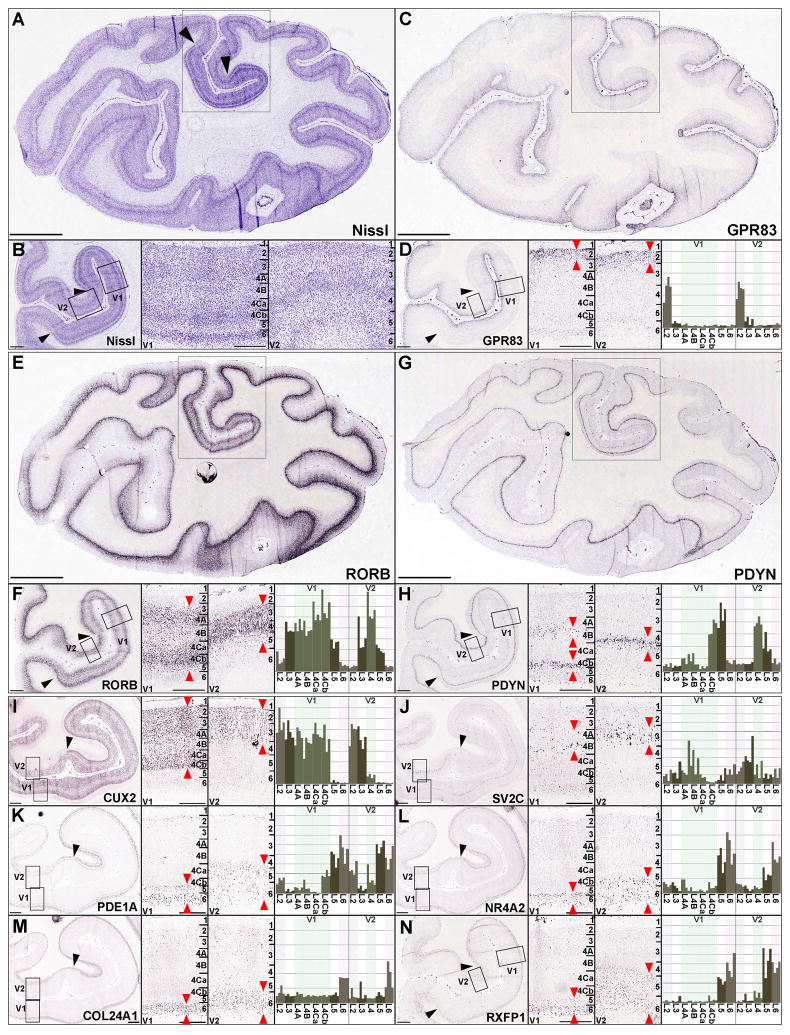
Figure 4. Layer-specific Gene Expression in Visual Cortical Areas.
(A and B) Coronal Nissl-stained section of caudal macaque neocortex containing areas V1 and V2 at low magnification (A) and higher magnifications (B). Left panel in (B) corresponds to boxed region in (A); right panels show high magnification views of areas V1 and V2 corresponding to boxes in left panel.
(C, E, G) Low magnification images of ISH labeling for GPR83 (C), RORB (E) and PDYN (G).
(D, F, G) Corresponding medium magnification image (left panel), high magnification views of V1 and V2 (middle panels), and histogram plots of gene expression for layer-specific samples in V1 and V2 (4 replicates per layer, right panels).
(F-N) ISH and microarray data for CUX2 (I), SV2C (J), PDE1A (K), NR4A2 (L), COL24A1 (M), and RXFP1 (N), displayed in the same format as upper panels. Black arrowheads delineate boundaries of V1, numerals in high magnification ISH and Nissl panels denote laminar architecture of V1 and V2, and red arrows denote regions of enriched expression. Scale bars: Low magnification images in A, C, E, G: 5mm; medium magnification images in B, D, F, H, I, J, K, L, M, N: 1mm, high magnification images: 500μm.

