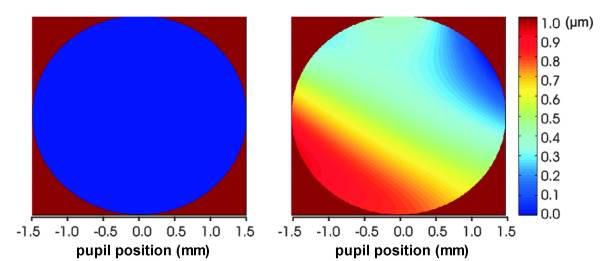
Figure 1.

Difference maps. Wavefront aberration difference maps between the central 3 mm pupil of the full-size pupil and the re-calculated central 3 mm as obtained by the "scaling" (left) and "direct" (right) methods. The vertical colour bar on the right shows corresponding wavefront aberration error in micrometers.
