Figure 5.

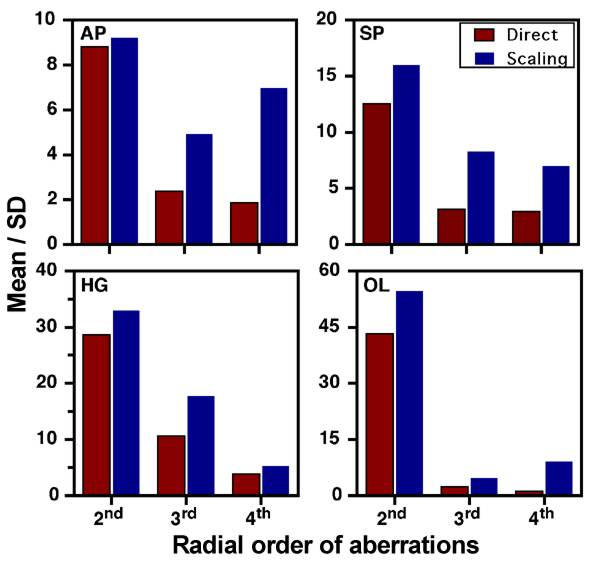
Signal-to-noise ratios for different radial order. Signal-to-noise ratios (mean / SD) for different radial orders of the wavefront aberration at 3 mm pupil as calculated by the direct and scaling methods. Data for all subjects are shown.

Signal-to-noise ratios for different radial order. Signal-to-noise ratios (mean / SD) for different radial orders of the wavefront aberration at 3 mm pupil as calculated by the direct and scaling methods. Data for all subjects are shown.