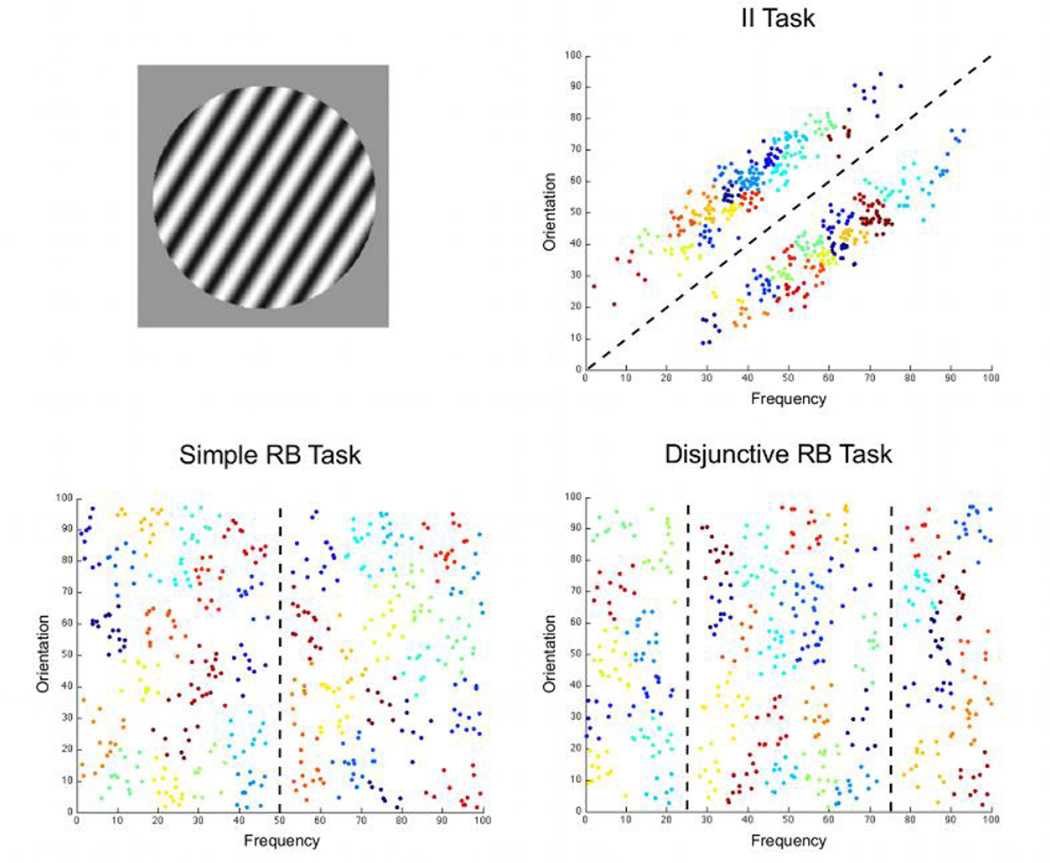
Figure 1.
Information about the tasks and stimuli used in the present study. The top-left panel shows an example stimulus. The other three panels show the category structures in each of the tasks. Dashed lines represent optimal bounds separating the two categories and different colors represent different clusters of stimuli revealed by a k-means cluster analysis (see section 2.4).

