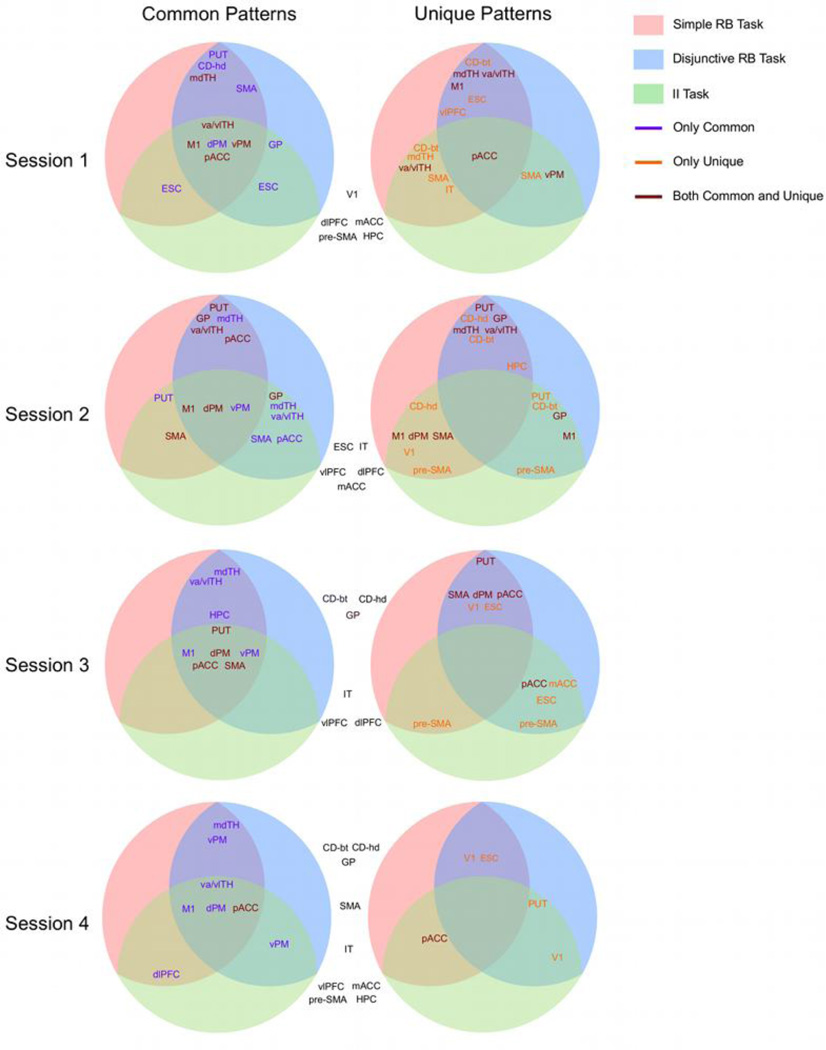
Figure 3.
Graphical summary of the results of the common patterns and unique patterns analyses. Each circle summarizes the results of one analysis in one particular session. Tasks are represented by colored areas inside the circle and the results of an analysis involving two tasks are presented at the intersection of the two corresponding areas. The list of ROIs represents those brain regions for which the analysis resulted in significantly accurate classification. A purple font indicates significant accuracy only in the common patterns analysis, an orange font indicates significant accuracy only in the unique patterns analysis, and a brown font indicates significant accuracy in both analyses. The list of ROIs outside the circles in black font indicates those brain regions for which neither of the two analyses resulted in significantly accurate classification. Abbreviations: vlPFC, ventrolateral prefrontal cortex; dlPFC, dorsolateral prefrontal cortex; mACC and pACC, middle and posterior anterior cingulate cortex, respectively; HPC, hippocampus; SMA, supplementary motor area; dPM and vPM, dorsal and ventral premotor cortex, respectively; M1, primary motor cortex; V1, primary visual cortex; ESC, extrastriate visual cortex; IT, inferotemporal cortex; CD-hd, head of the caudate nucleus; CD-bt, body and tail of the caudate nucleus; GP, globus pallidus; PUT, putamen; mdTH, medial dorsal nucleus of the thalamus; va/vlTH, ventral anterior and ventral lateral nuclei of the thalamus.

