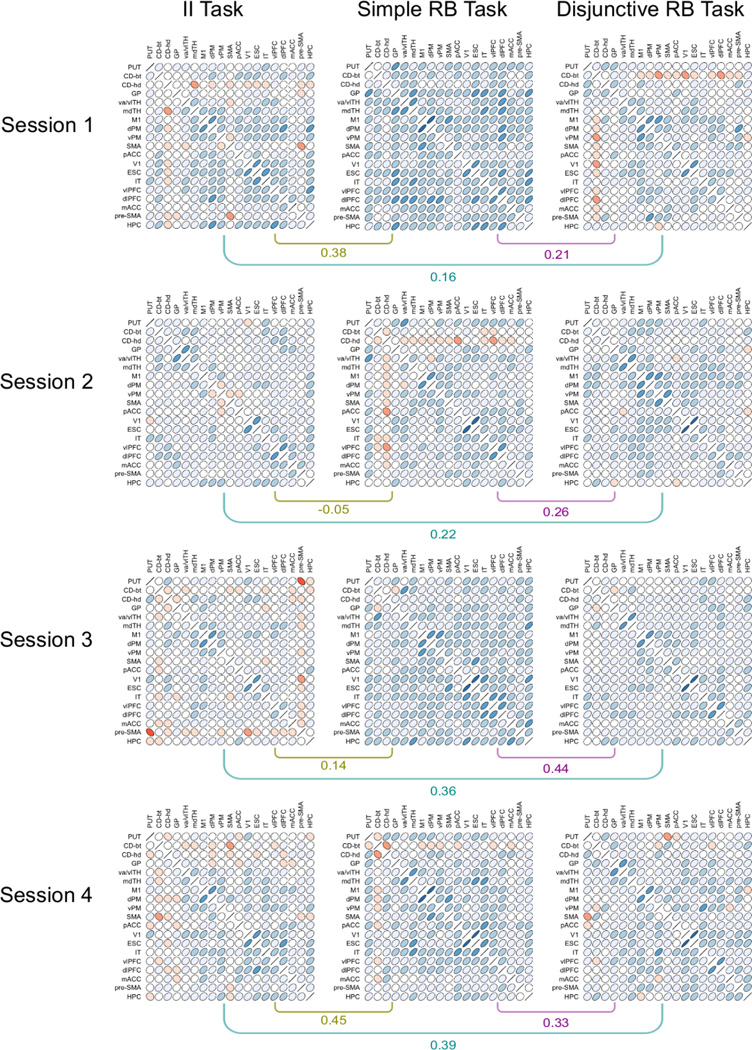
Figure 5.
Matrices of correlations between ROIs obtained in the classification similarity analysis and their pairwise correlations within each session. Each cell within a matrix displays a contour line from a bivariate normal density matching the observed correlation. Red ellipses represent negative correlations and blue ellipses represent positive correlations. The shade of color represents correlation magnitude, with darker color indicating higher absolute correlations.

