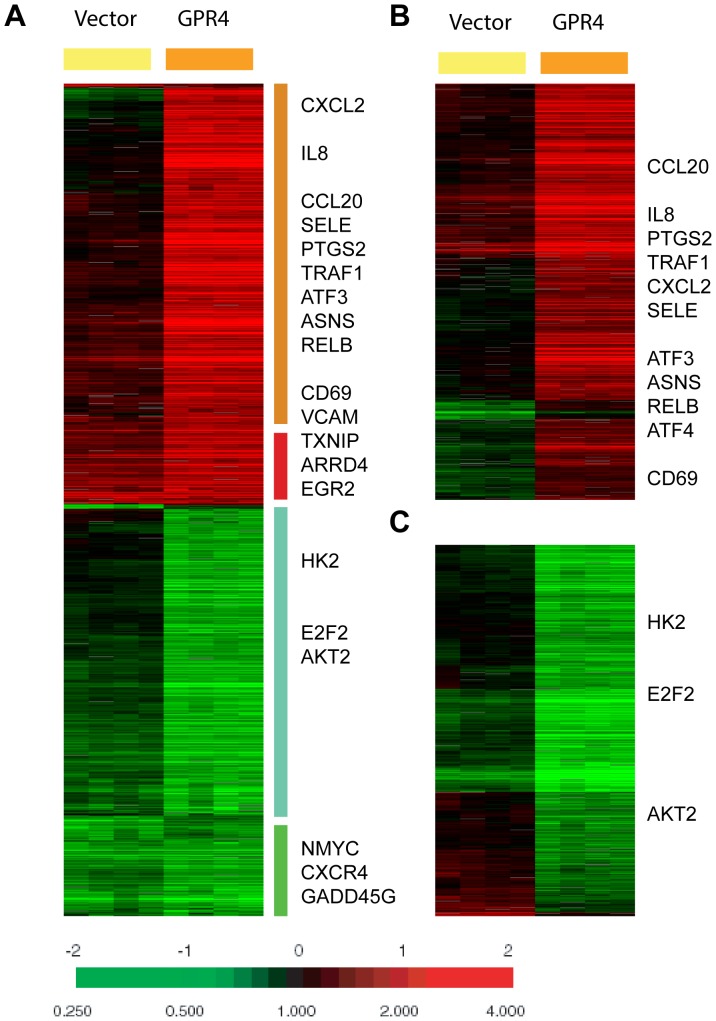
Figure 1. The global gene expression of acidosis response of HUVEC.
(A) The gene expression response of HUVECs transduced with the control vector or the GPR4 expression construct is shown. 1208 probes were selected by the criteria of at least three observations with at least three fold changes and arranged by hierarchical clustering. Clusters of genes which are induced or repressed in a GPR4-depedent or -independent fashion are shown with the names of selected genes. (B, C) The gene expression responses of the probes selected by SAM to be 941 GPR4-induced (B) or 679 GPR4-repressed (C) are depicted with the names of selected genes shown.

