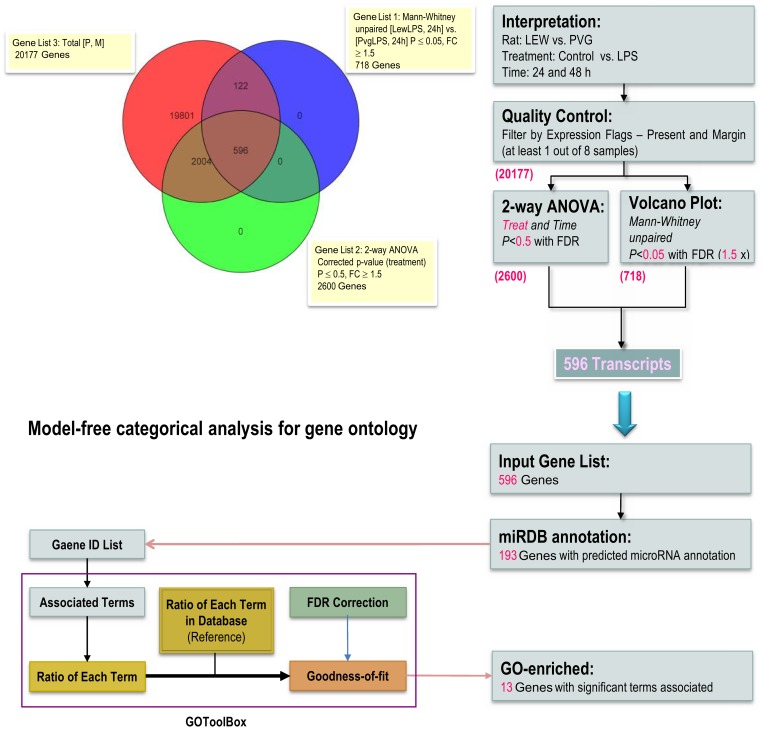
Figure 2. The less-stringent procedure of the knowledge-based enrichment analysis for detecting differentially expressed genes in the ASCs from the LEW and PVG rats.
A Venn diagram showing the number of gene transcripts that were shared and distinct among the differentially expressed genes identified using the less-stringent statistical criteria. The number of annotated gene transcripts resulting from each step is given in purple. The application of the model-free categorical analysis for GO enrichment was performed using the online GOToolBox software.

