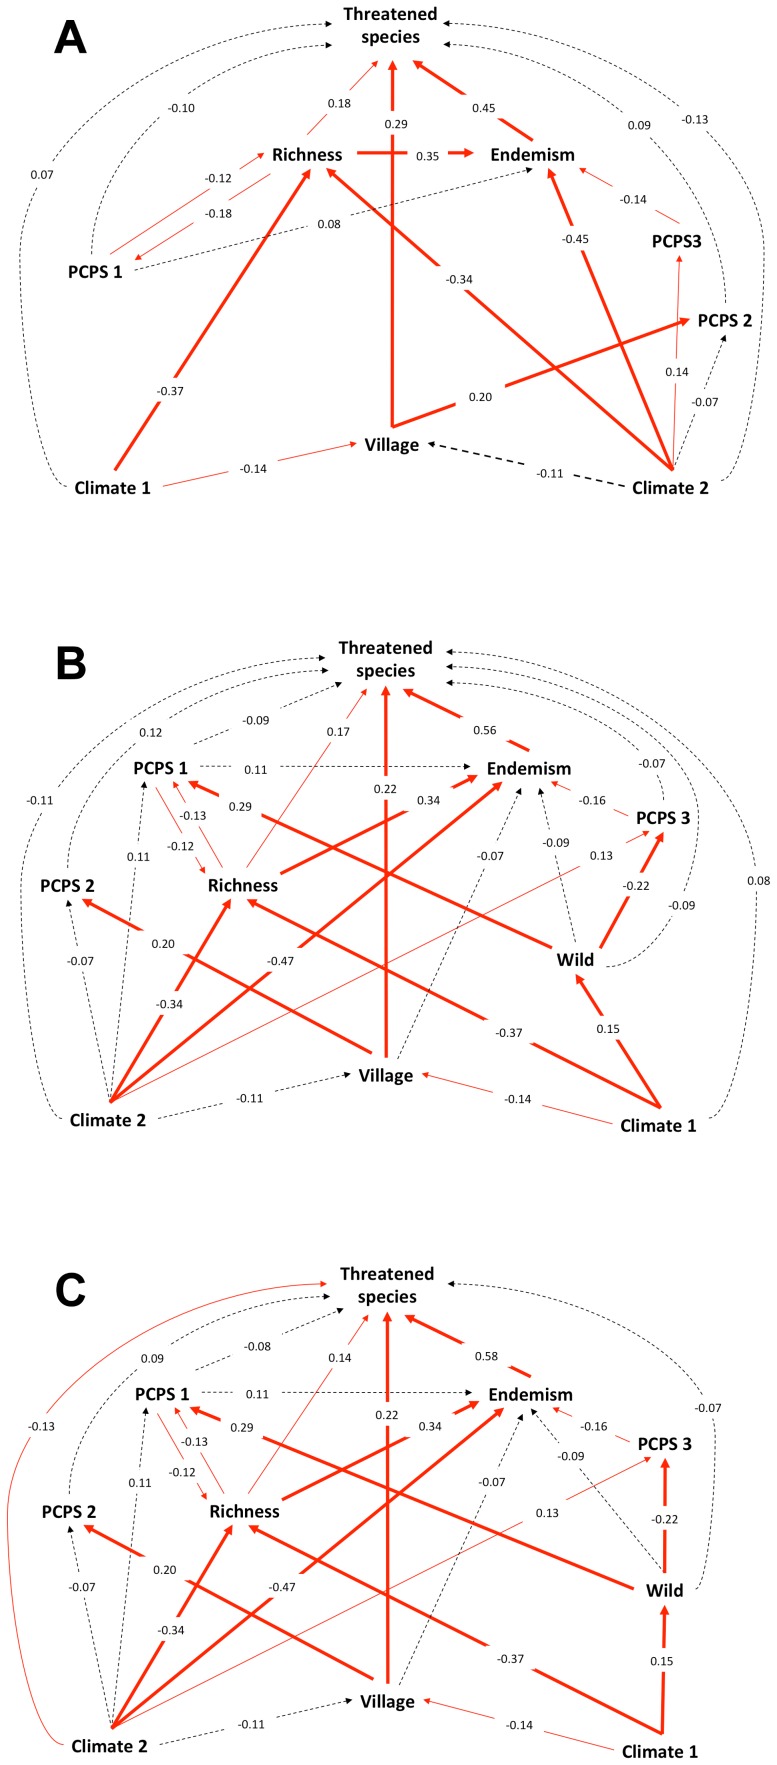
Figure 5. The final path model for the most urgent (a), the moderate (b) and the most inclusive (c) scenario, showing the causal relationships between climate axes (Climate) 1 and 2, proportion of village cover (Village) in each ecoregion, principal coordinates of phylogenetic structure (PCPS) 1, 2 and 3, amphibian richness (Richness) per ecoregion, the number of endemic species (Endemism) in each ecoregion and the number of threatened amphibian species in each ecoregion.
Black dashed lines represent non-significant relationships between variables. Red lines represent significant path coefficients between variables and the line width represents the P value; narrow lines indicate to 0.05≥P≥0.01 and thick lines indicate P≤0.01. The path coefficients in the arrows are the standardized regression coefficients. The P values were obtained by randomization test.

