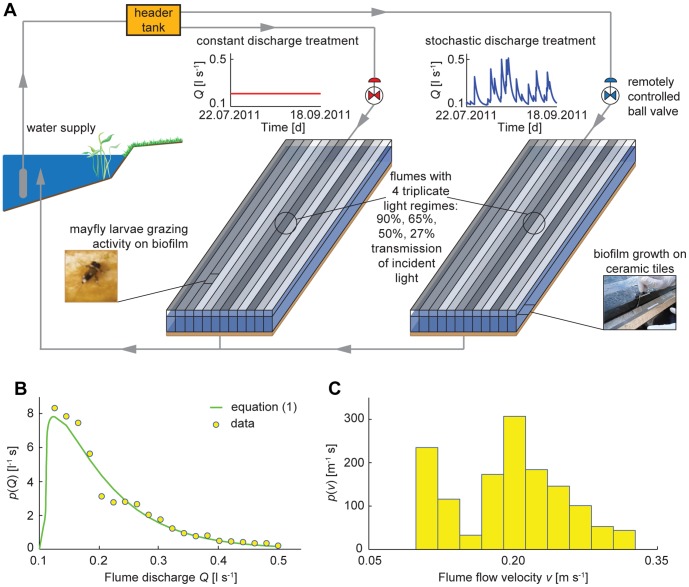
Figure 1. Experimental setup.
(a) Schematic representation of the experimental facilities, with details on discharge and light treatments, biofilm growth on tiles and mayfly larvae grazing activity. (b) Probability distribution function of flume discharge  : dots represent the experimental distribution, the green solid line shows the imposed distribution. (c) Probability distribution function of flume flow velocity,
  , derived from measured data.

