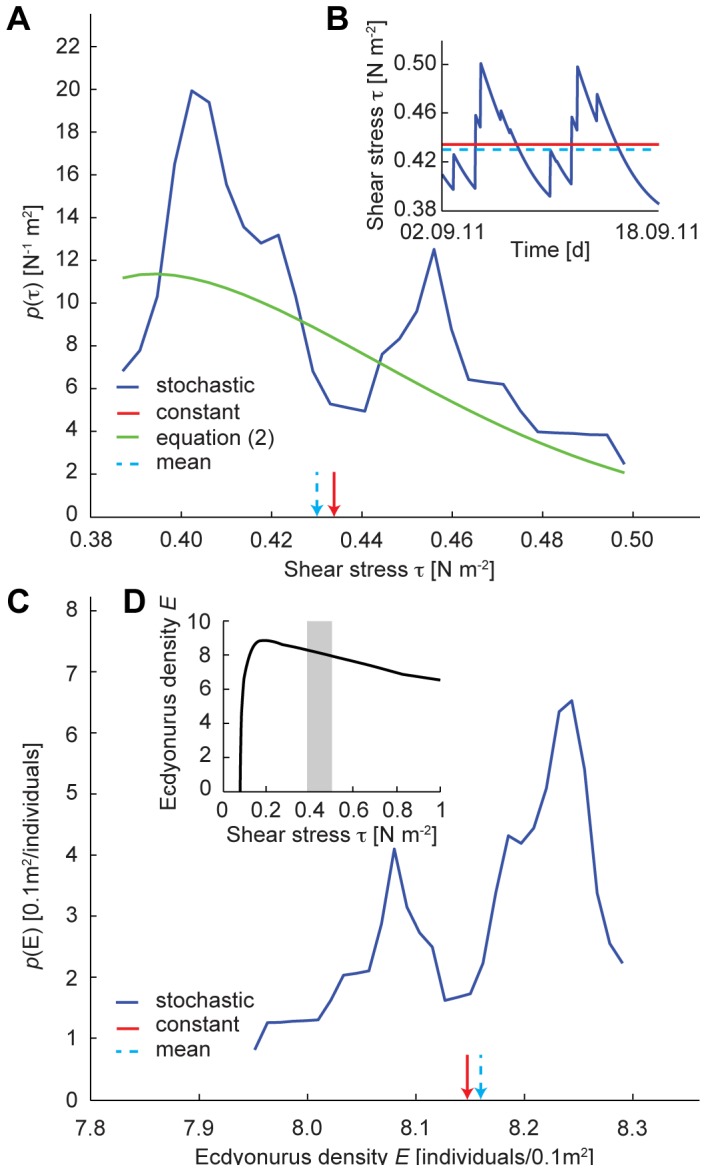
Figure 7. Suitability of experimental shear stress conditions for Ecdyonurus sp. larvae.

(a) Probability distribution function (pdf) of shear stress,  : blue and green solid lines represent the empirical and the analytical pdfs, respectively; red solid arrow represents the shear stress
  under constant discharge conditions; light blue dashed arrow represents the mean shear stress
  under stochastic discharge conditions. (b) Temporal sequence of shear stresses during grazing, from September 2nd to September 18th 2011: blue and red solid lines represent shear stresses in the stochastic and in the constant discharge treatment, respectively; light blue dashed line represents the mean shear stress
  in the stochastic regime. (c) Probability distribution function of Ecdyonurus density
  (from re-evaluation of existing field data [58]): blue solid line refers to the stochastic discharge treatment, red solid arrow refers to the constant discharge treatment, light blue dashed arrow represents the expected mean value under the stochastic regime. (d) Ecdyonurus habitat suitability curve (from re-evaluation of existing field data [58]): the grey area highlights the experimental range of shear stress.
