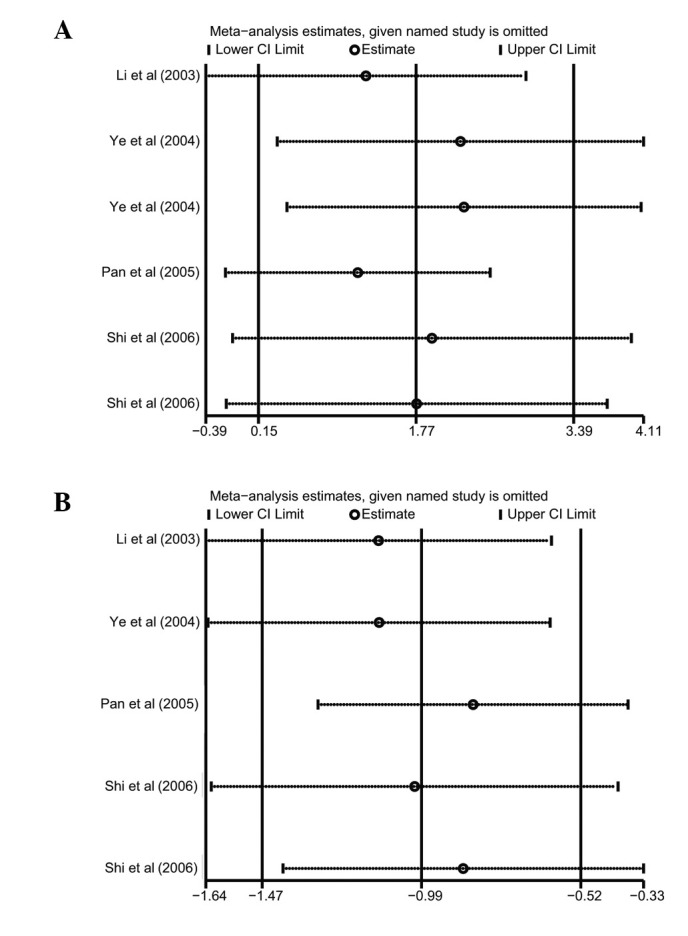
Figure 6.

Sensitivity analysis of pulmonary function and QOL analysis. Results were computed by omitting each study in turn. Meta-analysis random-effects estimates were used. The two ends of the dotted lines represent the 95% CI. QOL, quality of life; CI, confidence interval.
