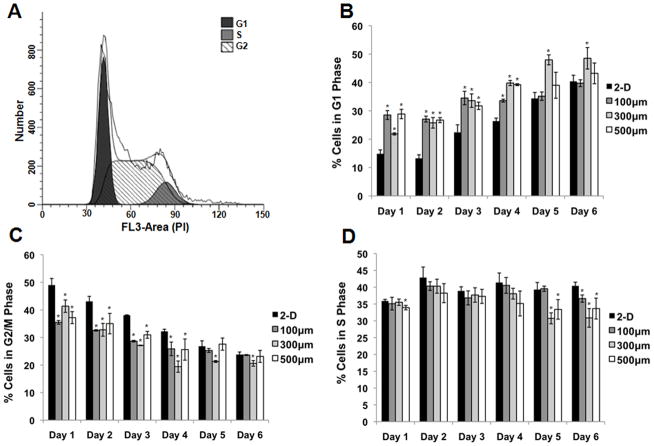
Figure 4. Cell cycle distribution varies with culture time.
hESCs were cultured on 2-D controls (Matrigel-coated TCPS) and in 100, 300, or 500 μm/side microwells for 6 days. Every 24 hours cells were harvested, fixed, and staining with propidium iodide (PI). Flow cytometry was used to evaluate PI intensity, and the data was entered into ModFit software to analyze the fraction of cells in each phase of the cell cycle. A sample histogram of fitted data is shown in panel (A). The percentage of cells in the G1 (B), G2/M (C), and S (D) phases of the cell cycle was plotted at each timepoint. As culture time increased, the relative percentage of cells in G1 increased while the relative percentage of cells in G2/M decreased. Differences in G1 and G2/M percentages between cells in 2-D and microwells were more pronounced at earlier culture times (* indicates P<0.05 compared to same-day 2-D control).

