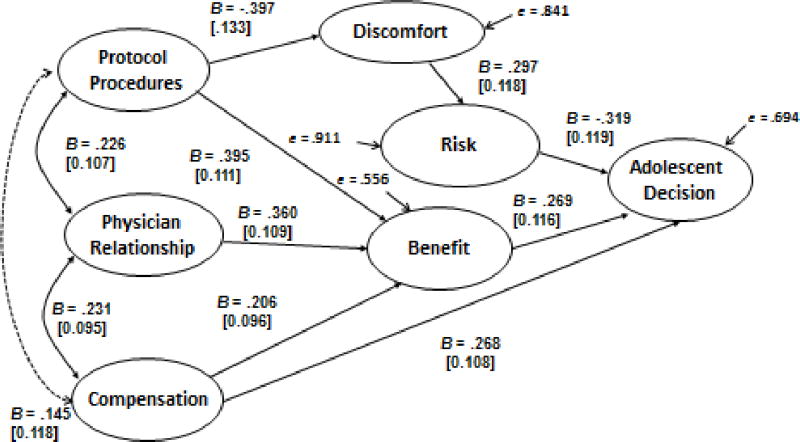
Figure 1.
Unstandardized structural model of adolescent participation decision. Numbers in brackets are standard errors, B’s are unstandardized path coefficients, solid lines represent significant pathways and the dotted line represents a non significant pathway. Overall goodness of fit χ2(216) = 313.13, p < .001, RMSEA = .064, test of close fit (RMSEA < .05), p < .07. The model includes three correlated residuals (see Table 1).

