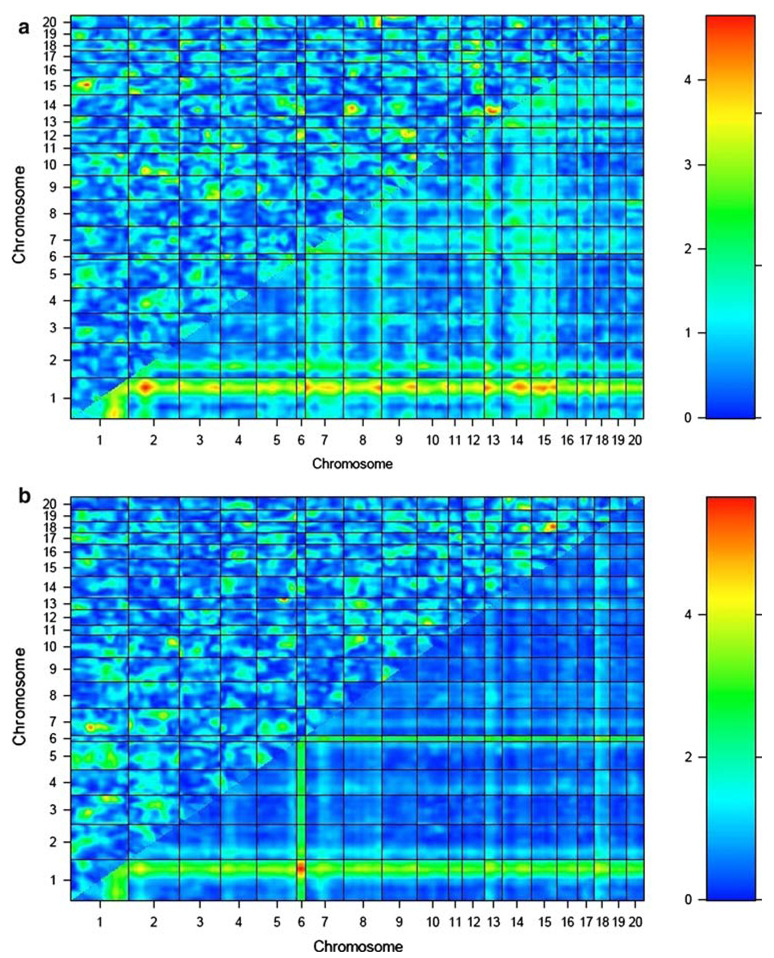
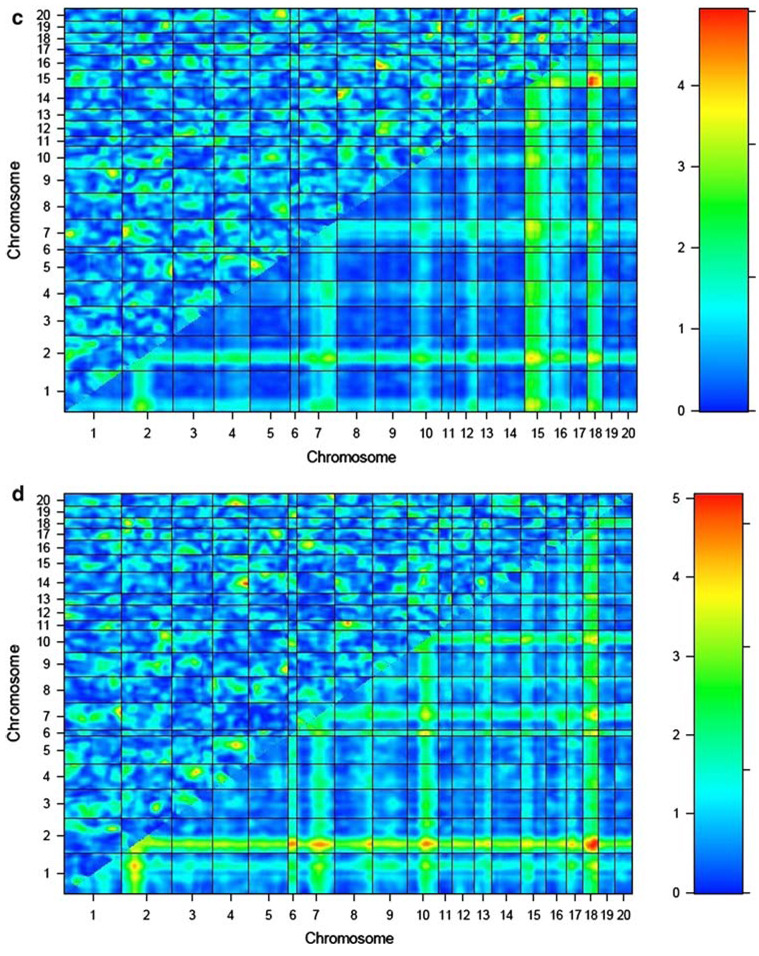
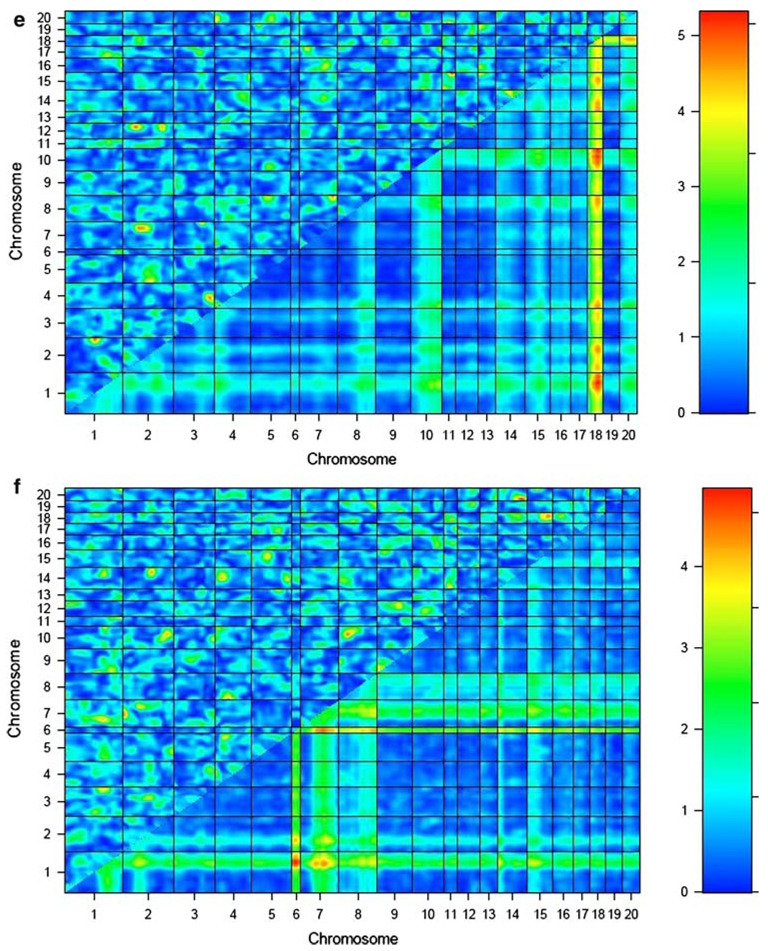
Fig. 1.
Epistasis plots for BMD phenotypes for COP/DA rat F2 offspring. Interaction effect is shown in the upper-left triangle in each plot, with color intensity corresponding to the LODint as indicated in the scale to the right of each plot. BMD phenotypes are as follows: a lumbar spine aBMD, b whole femur aBMD, c lumbar vBMD, d femur neck vBMD, e femur midshaft vBMD, and f distal femur vBMD


