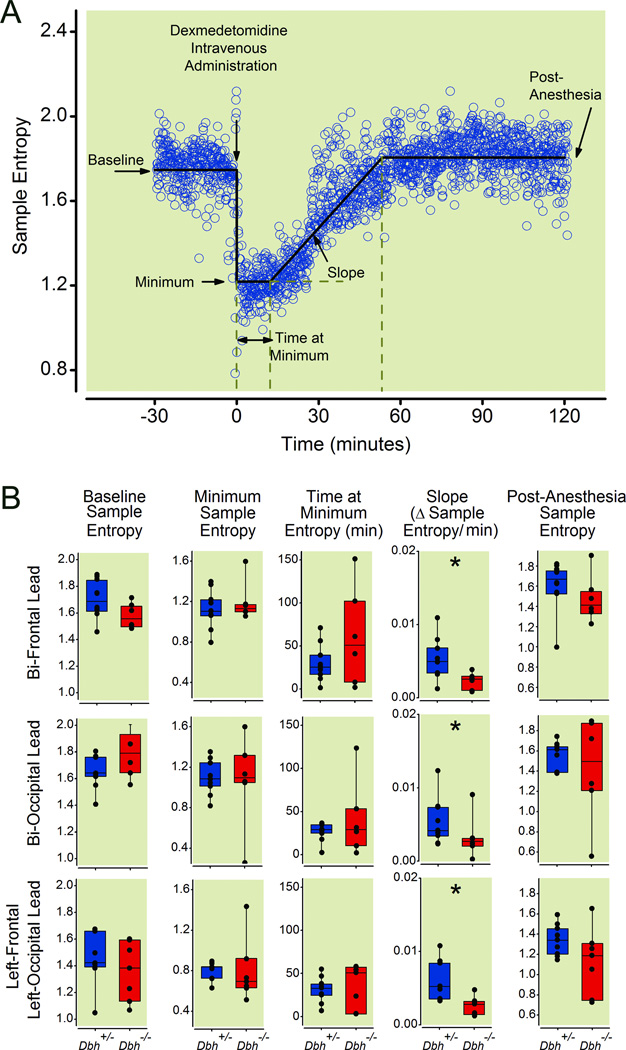
Fig. 5.
Dbh−/− mice show delayed emergence from dexmedetomidine relative to Dbh+/− mice using a motor-independent electroencephalographic measure. (A) Panel shows a characteristic segmental best-fit (solid line) analysis of sample entropy values calculated from raw electroencephalogram in a control mouse before, during, and after intravenous dexmedetomidine. Raw sample entropy values (circles) were calculated from the electroencephalogram, which were fit with five linear segments to approximate five variables as labeled. Dexmedetomidine was administered intravenously at time=0 as denoted by the arrow. (B) Box plots illustrate sample entropy values along with lower quartile, upper quartile, group minimum and group maximum for pre-drug baseline wakefulness, minimum entropy level, the duration of time at the minimum entropy level, the slope of sample entropy recovery that defines emergence, and sample entropy post-dexmedetomidine emergence for Dbh+/− (n=12) and Dbh−/− (n=8) mice as computed from right frontal-left frontal, right occipital-left occipital, and left frontal-left occipital leads. * denotes p < 0.05 in Dbh−/− mice relative to Dbh+/− mice. Dbh: dopamine β-hydroxylase.

