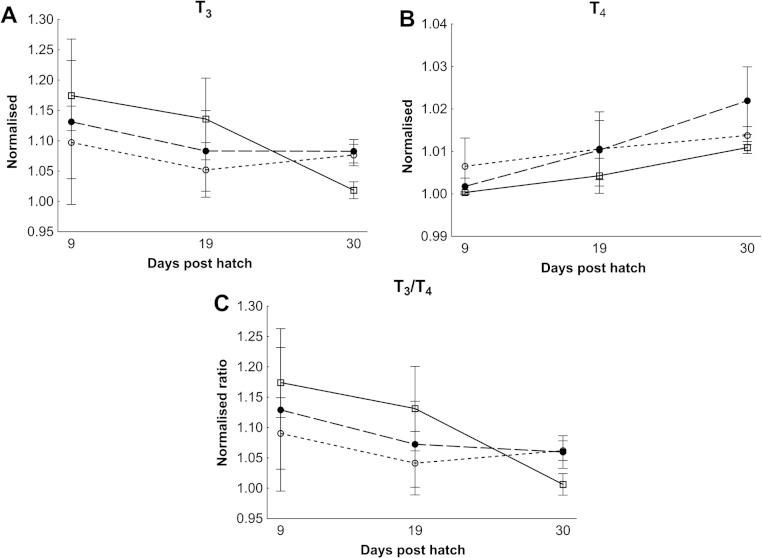
Figure 5. Cod larvae thyroid hormone levels and ratios.
Normalised mean thyroid hormone levels (NML) in cod larvae fed either control (□), MI (○) or HI (●) rotifers. Graph A is tri-iodothyronine (T3), Graph B is thyroxine (T4), while graph C is the ratio between the NML of T3/T4. Data are mean ± SD (n = 3) for all data points except controls at 30 dph which has an outlier removed in graph B and C (n = 2).

