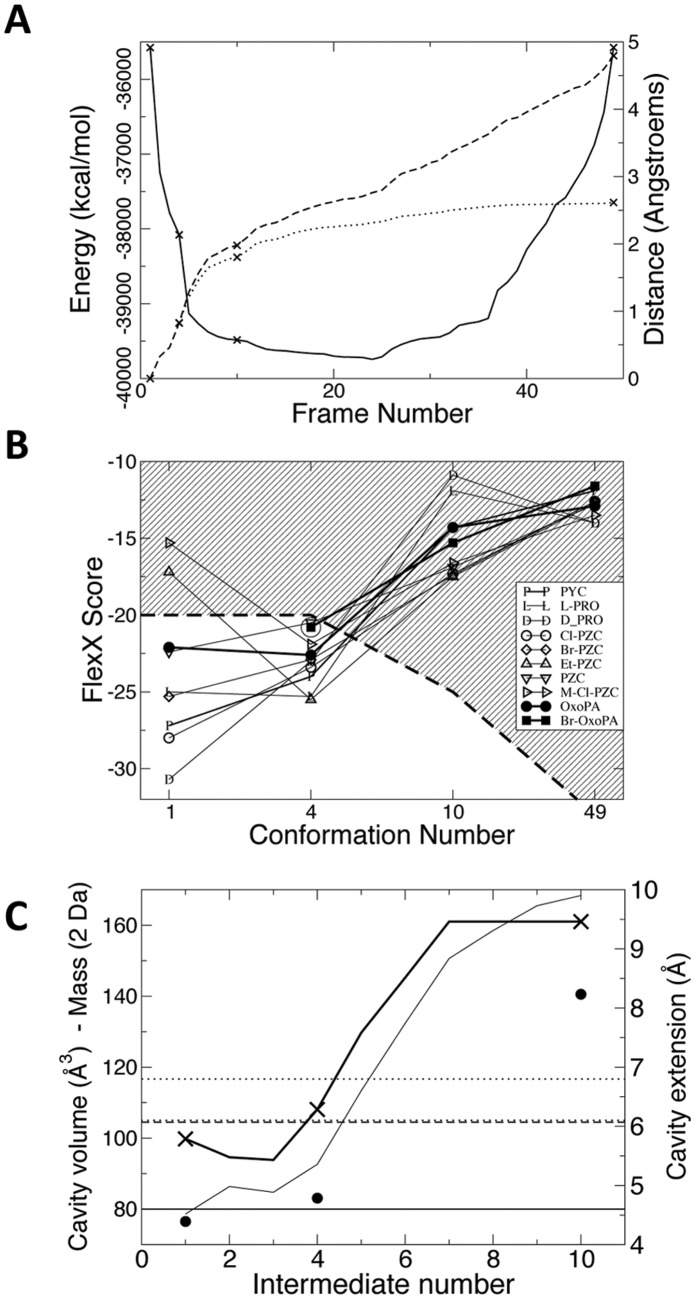
Figure 3. Transition path characteristics.
(A) Energy profile and metric quantities for the TcPRAC transition path. The energy profile (full line) shows that the intermediate states have low energy and do not present any energy barriers. Dotted and dashed lines show the distance from the first structure (d1,i) and the cumulative distance covered from the first structure (l1,i), respectively (RMS in Å, see Material and Methods). Little swerving was necessary to avoid the energy barriers. The points corresponding to the intermediate structures used in the screening are marked by crosses. (B) Scores of known ligands, synthesized analogues, and new inhibitors when docked in the selected binding site models. Br-OxoPA could not be docked in the crystallographic structure and its score in the fourth conformation is circled. The score threshold that was chosen in the subsequent virtual screening phase for ligand selection is indicated by a dashed line and the exclusion region is striped. Transition path characteristics. (A) Energy profile and metric quantities for the TcPRAC transition path. The energy profile (full line) shows that the intermediate states have low energy and do not present any energy barriers. Dotted and dashed lines show the distance from the first structure (d1,i) and the cumulative distance covered from the first structure (l1,i), respectively (RMS in Å, see Material and Methods). Little swerving was necessary to avoid the energy barriers. The points corresponding to the intermediate structures used in the screening are marked by crosses. (B) Scores of known ligands, synthesized analogues, and new inhibitors when docked in the selected binding site models. Br-OxoPA could not be docked in the crystallographic structure and its score in the fourth conformation is circled. The score threshold that was chosen in the subsequent virtual screening phase for ligand selection is indicated by a dashed line and the exclusion region is striped. (C) Cavity volume and extension in transition path intermediates, and docked molecules properties. Volume and extension are calculated as explained in Material and Methods. The volume is displayed by the thin line curve. Cavity extension is displayed by the thick curve and crosses mark intermediates that were used for virtual screening. The extension of PYC is shown by the horizontal line, that of OxoPA in all-trans conformation is shown by the horizontal dashed line. The extension of BrOxoPA in all-trans conformation is given in dotted line for two extreme rotamers on the C4–C5 bond. The average molecular weight of the library compounds successfully docked in conformers 1, 4 and 10 is displayed by filled circles. For clarity, the average mass has been divided by 2 to fit the same scale as the cavity volume.

