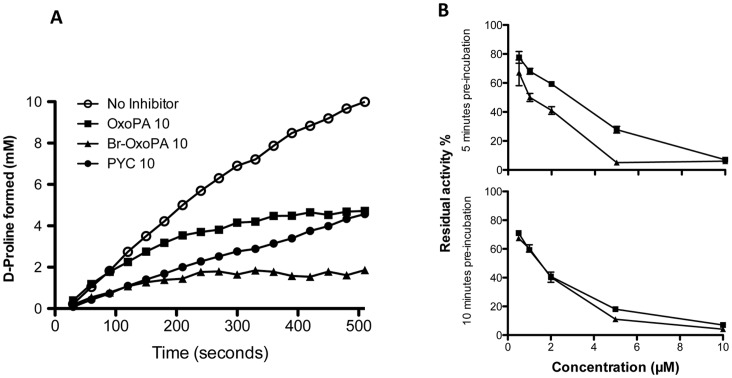
Figure 5. Kinetics of D-proline formation with time in the presence or absence of TcPRAC inhibitors.
(A) Concentrations of D-proline formed were determined by polarimetry in reaction assays containing 0.15 µM of TcPRAC and 40 mM L proline (see Material and Methods). Optical rotation was measured every 10 s for 8 min, with 10 µM PYC competitive inhibitor (black circles), 10 µM OxoPA (black squares) and 10 µM Br-OxoPA (black triangles), or without inhibitor (white circles). (B) Percentage of residual activity after pre-incubation of the enzyme with different concentrations of OxoPA and BrOxoPA for 5 minutes (upper panel) and 10 minutes (lower panel).

