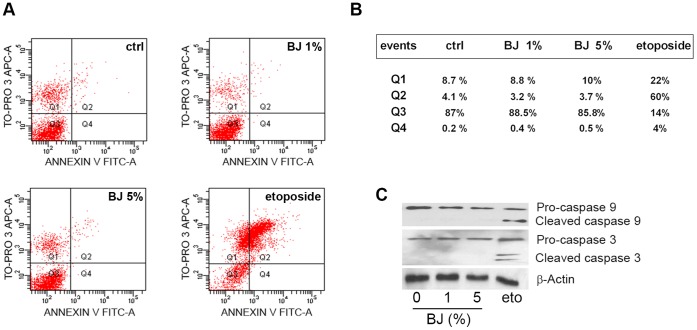
Figure 4. Evaluation of apoptosis on the SH-SY5Y cells exposed to BJ.
(A) Cytofluorimetric evaluation of apoptosis; representative Annexin V versus PI dot plot analyses of SH-SY5Y cells treated with BJ for 72 hs. (B) Mean percentage of events in each quarter (Q) of cytofluorimetric analyses: Q3 contains the vital cells, Q4 the cells in early apoptosis, Q2 the cells in late apoptosis and Q1 the necrotic cells. The FACS analysis presented is representative of three different experiments. (C) Analysis of caspase-3 and caspase-9 expression in SH-SY5Y cells treated for 72 hs with BJ or etoposide (eto). Lower molecular weight bands of caspases represent the active form. Data show the lack of apoptosis after 72 hs of exposure to BJ.

