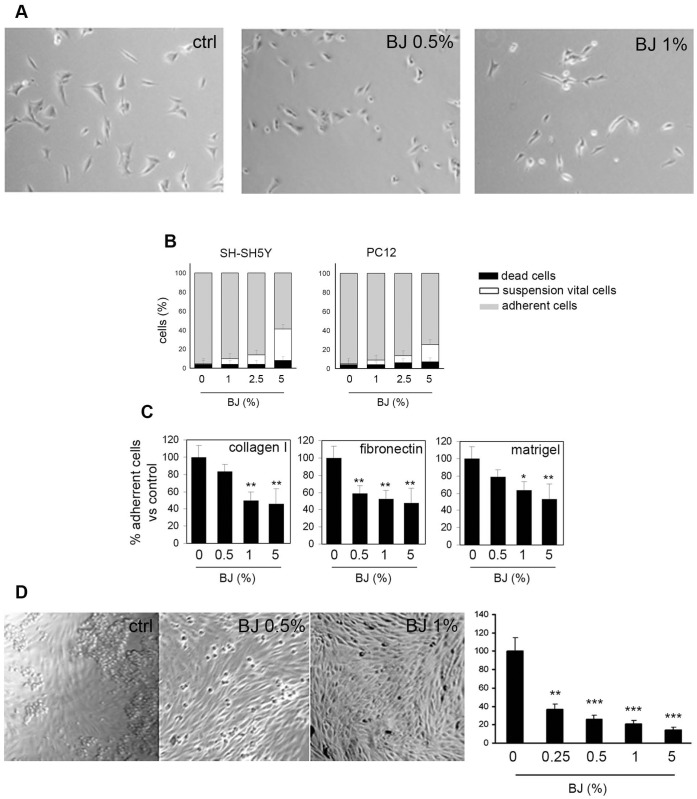
Figure 6. Adhesion inhibition by BJ treatment.
(A) Representative images showing the decreased adhesive capacity of SH-SY5Y cells following 2 hs of BJ treatment. Cells were visualized by optical microscopy at a magnification of 200x. (B) Adhesion assay performed by plating SH-SY5Y and PC12 cells on non-coated plastic surface for 24 hs. Data were expressed as percentage of the total cells present in the well and are the mean ± SEM of three different experiments. (C) Number of adhered cells obtained after plating SH-SY5Y cells on three different physiological substrates (Collagen I, Fibronectin and Matrigel) in presence of BJ for 24 hs. The values are expressed as mean percentage with respect to untreated cultures of three different experiments (± SEM). (D) Adhesive skill of SH-SY5Y cells treated with BJ at 0.5 and 1% in comparison with untreated cells when seeded on HUVEC monolayers. Representative images show the decrease capability of SH-SY5Y cell (see the number of round cells) to join to HUVEC cells. Values obtained by counting attached SH-SY5Y cells are shown in the histogram. Data are expressed as mean ± SEM counts of five different optical fields. *P<0.05; **P<0.01; ***P<0.001 vs control. Collectively the results demonstrated that BJ impaired cells adhesiveness.

