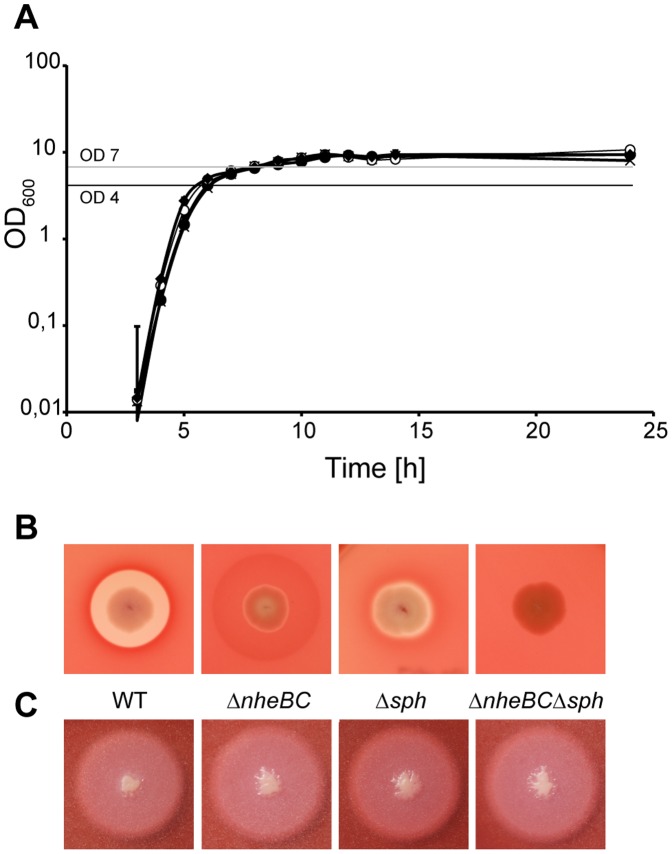
Figure 3. Growth behavior and colony phenotypes of parental and mutant B. cereus strains.
B. cereus NVH 0075-95 (WT, •), isogenic nheBC (ΔnheBC, ×), sph (Δsph, ♦) and nheBC sph (ΔnheBCΔsph, <$>\raster="rg1"<$>) null mutants. Strains were cultivated in LB at 37°C and growth was monitored by measuring optical density at 600 nm (OD600) (A). Error bars represent standard errors derived from n = 3 independent experiments. Colony morphology on (B) Columbia Blood agar (5% sheep blood, Oxoid) and (C) MYP agar (mannitol egg yolk polymyxin agar, Oxoid) was used for specific detection of beta-hemolytic (visible as cleared zones around colonies) and PC-PLC enzyme activity (lecithin precipitation zone), respectively.

