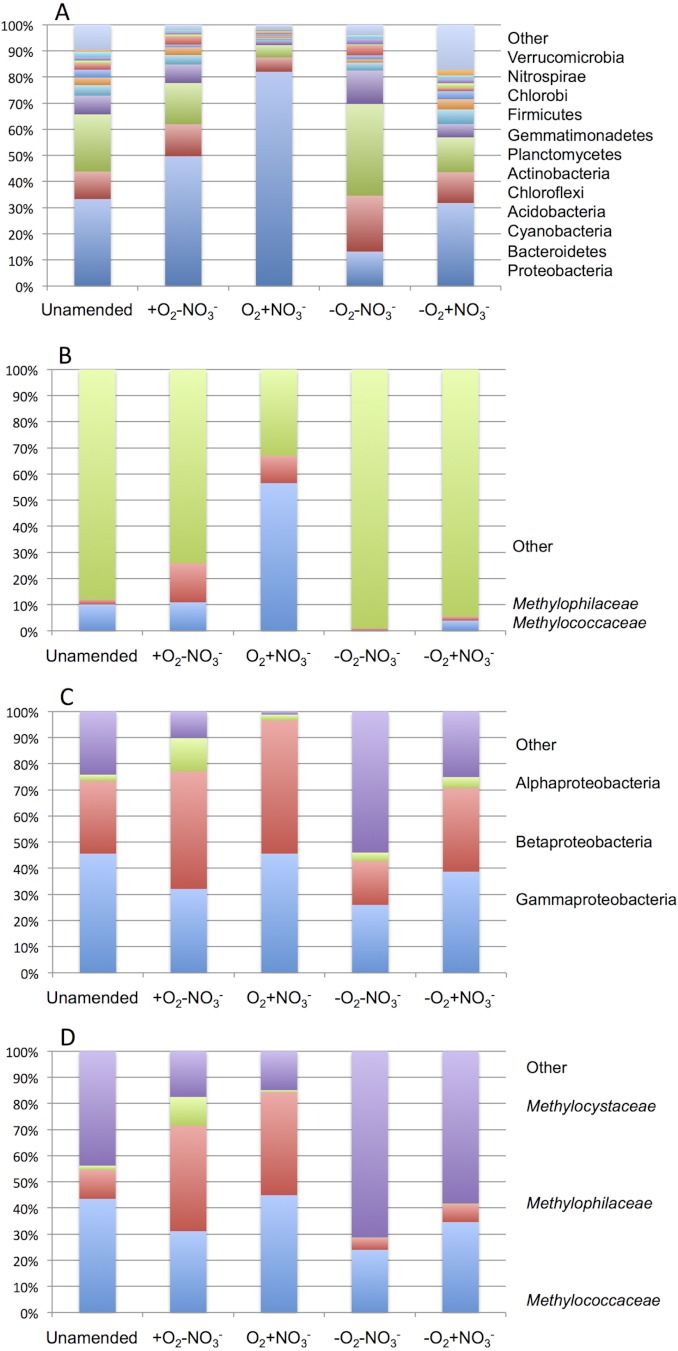
Figure 2.
Taxonomic profiling of microcosms based on pyrotag analysis (A and B) and metagenome data analysis (C and D) shows high abundance of Methylococcaceae and Methylophilaceae in aerobic conditions. A. Distribution of pyrotag sequences among major phyla. Other, phyla making up less than 1% of total. B. Proportions of Methylococcaceae and Methylophilaceae sequences in pyrotag libraries. C. Distribution of sequences in metagenomes taxonomically classified at 90% identity level. D. Proportions of Methylococcaceae, Methylophilaceae and Methylocystaceae of total sequences taxonomically profiled at 90% identity level.

