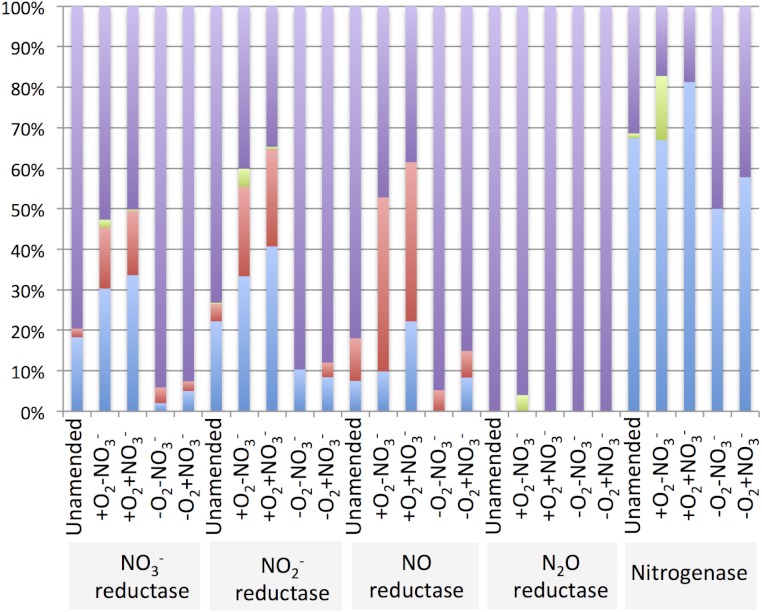
Figure 4.
Relative abundance of nitrate metabolism genes ascribed to Methylococcaceae (blue), Methylophilaceae (red) and Methylocystaceae (green). Other (purple) represents a variety of phylotypes, including methylotrophs of other families, present at low abundances. See Supplemental Tables 4–8 for statistics.

