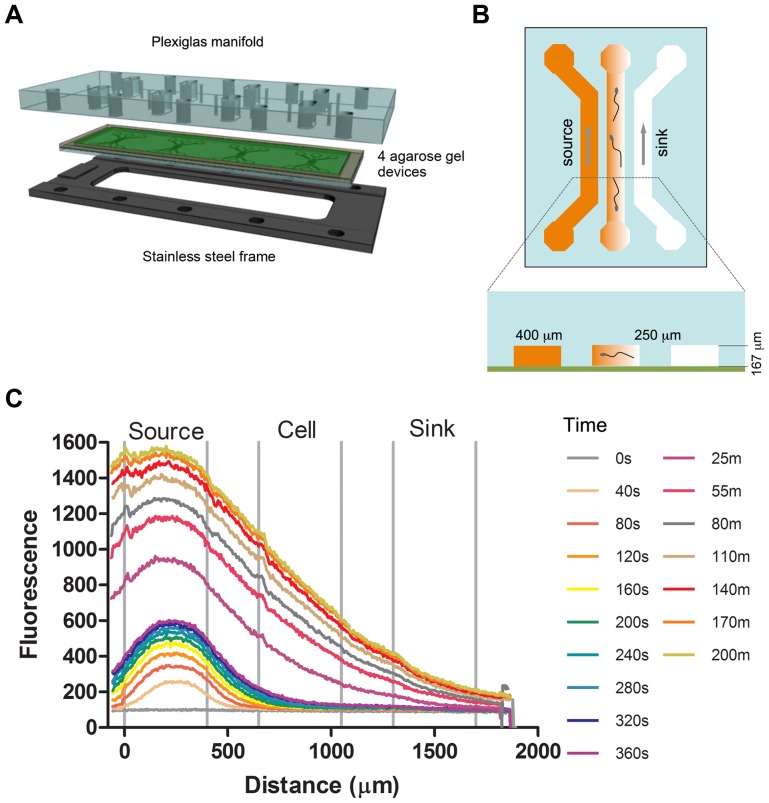
Figure 1. Microfluidic device setup, operation principle and calibration.
(A) Device setup. Four devices were patterned on a 1 mm thick agarose gel membrane, which was sandwiched between a Plexiglas manifold and a stainless steel supporting frame (Drawing credit: Andrew Darling). (B) Device layout. Each device contained three parallel channels that were 400 µm wide and 167 µm deep, and spaced 250 µm apart. Sperm are not shown to scale. This drawing is reproduced from Ref. [45] by permission of The Royal Society of Chemistry. Chemical/buffer were flowed through two side channels and a chemical gradient formed in the center channel via molecular diffusion through the agarose ridges between the center and the side channels. (C) Device characterization. Time evolution of fluorescence intensity profile across all three channels when flowing 4 kDa FITC-dextran/buffer along the source and sink channels respectively. Time (t) = 0 is defined as the time when the chemoattractant was flowed into the source channel.

