
Figure 4. Quantitative analysis of sea urchin and mouse sperm migration pattern.
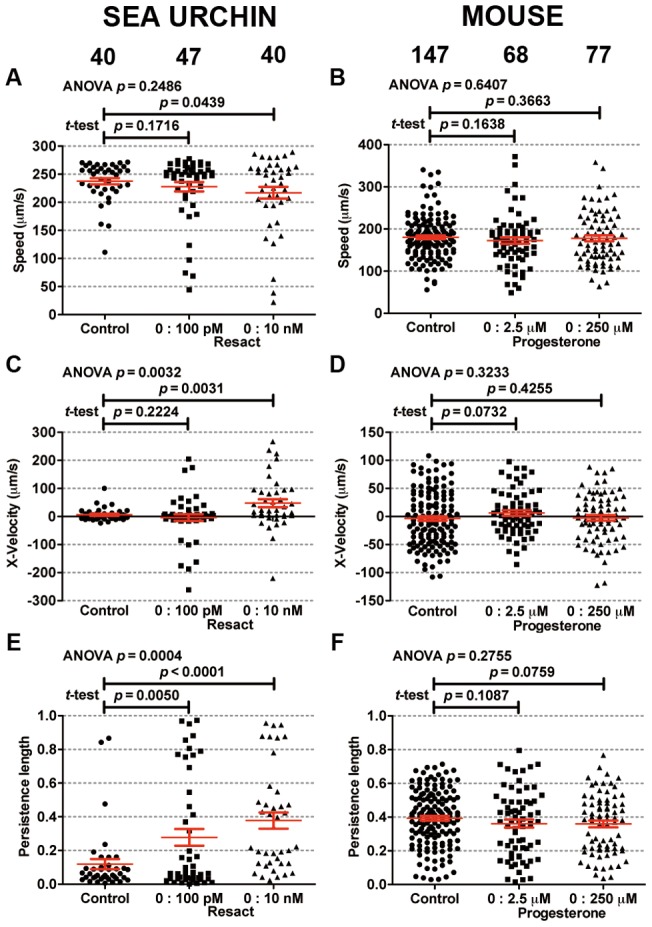
Scatter plot of the speed of sea urchin (A) and mouse (B) sperm. Scatter plot of the velocity up the chemical gradient for sea urchin (C) and mouse (D) sperm. Scatter plot of the persistence length for sea urchin (E) and mouse (F) sperm. Cell numbers that contribute to the scatter plot are indicated. The duration of the cell track length ranges from 0.24 s to 38.0 s for sea urchin, and from 0.12 s to 13.76 s for mouse sperm.