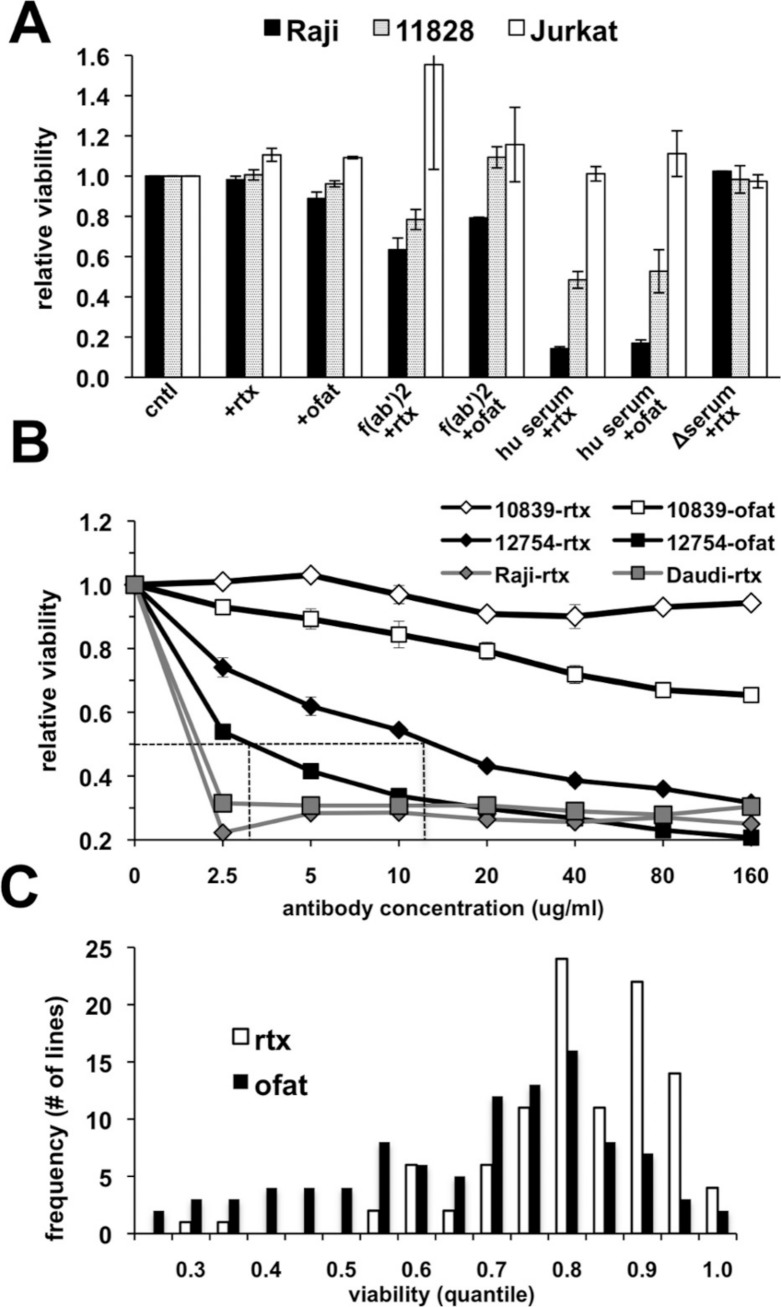
Figure 1. Variable cell responses in anti-CD20 mediated CDC assays.
(A) Cells were treated with 10 µg/ml of rituximab or ofatumumab under various conditions: in normal media, in the presence of: −F(ab’)2, −25% human serum (hu serum), or -heat-inactivated serum (Δserum) overnight. Cell viability was then quantitated using Alamar Blue. Results are represented as a ratio of viability under each condition: with/without antibody. Results are expressed as an average of a single experiment with duplicates ±SEM and are representative of three such experiments. (B) To establish dose response curves, cells were treated with serially diluted concentrations of antibody in the presence of 25% human serum. Results are expressed as indicated above and representative of at least three experiments. (C) Survey of CEPH LCLs sensitivity toward rituximab and ofatumumab. A panel of CEPH cell lines (n = 92) were assayed for their relative sensitivity toward anti-CD20 antibodies using CDC assays containing 10 µg/ml of either rituximab or ofatumumab in the presence of 25% human serum. The results are plotted as a frequency histogram showing the distribution of responses to either antibody. Data used are the average of at least 5 individual experiments performed in duplicate.

