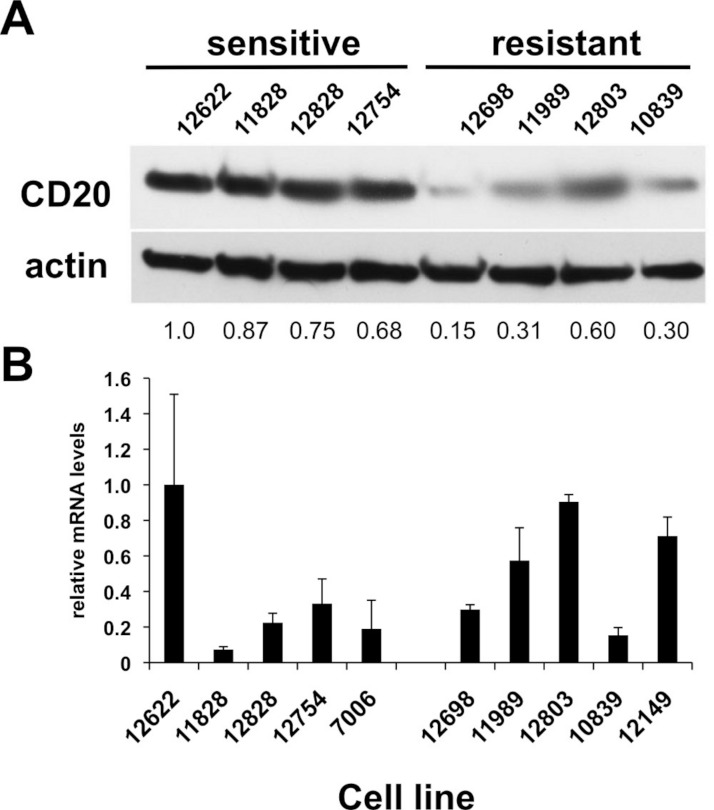
Figure 2. CD20 protein and mRNA levels in sensitive or resistant lymphoblastoid cell lines.
A) Western blotting was performed on cellular extracts from lymphoblastoid cell lines previously identified in surveys of cell lines as either sensitive (lanes 1–4) or resistant (lanes 5–8) toward rituximab. Following densitometry, relative CD20 protein levels are expressed by normalizing to the leftmost sample (12622) after correction for equal protein loading using β-actin as a load control. B) CD20 mRNA transcript levels were measured by qPCR. GAPDH was used as a load control and data is expressed by normalizing to the leftmost sample (12622). Results are the average of duplicates (±SEM) and representative of three experiments.

