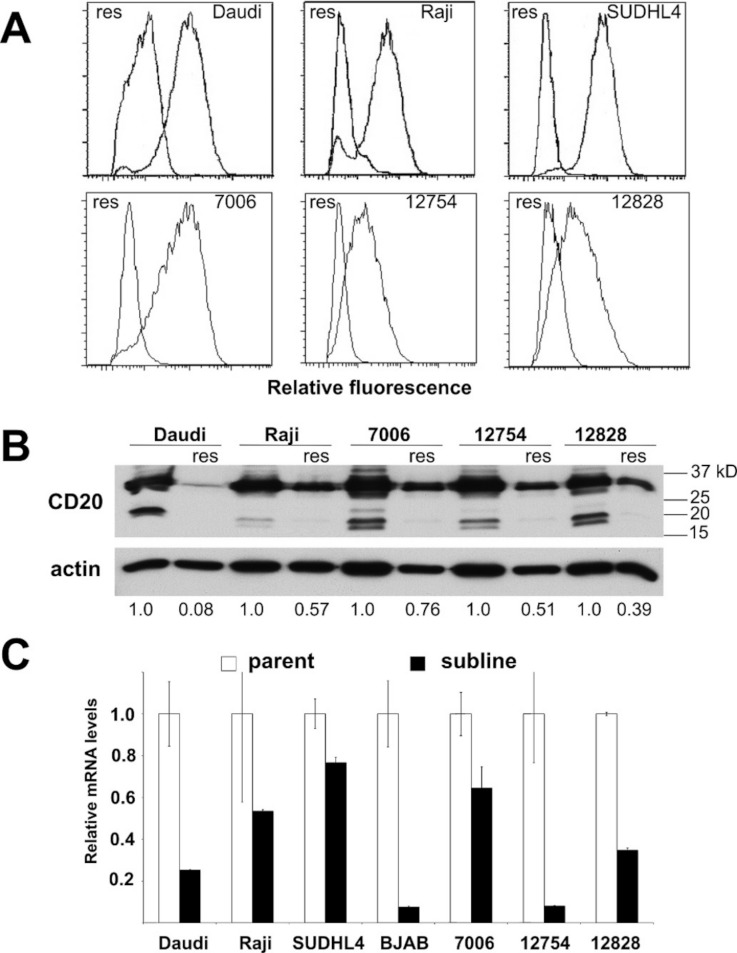
Figure 3. CD20 surface expression as well as protein and mRNA levels in parental and resistant sublines.
A) Histogram of CD20 surface expression following flow cytometric analysis of parental cell lines (right trace, each panel) and resistant sublines (left trace). B) Western blot of CD20 protein expression (upper band). CD20 protein levels are expressed by normalizing to the corresponding parental line after correction for equal protein loading using β-actin as a load control. C) Relative CD20 mRNA levels were estimated using qPCR. GAPDH was used as a load control and data are normalized to the parental line. Results are the average of duplicates (±SEM) and representative of three experiments.

