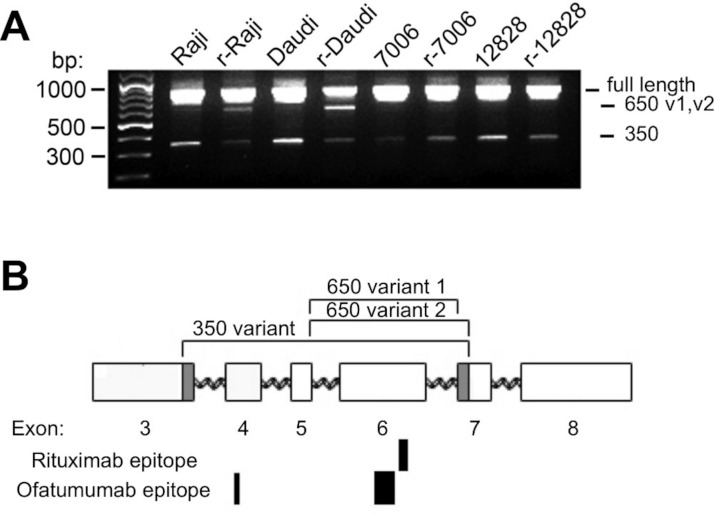
Figure 4. CD20 mRNA splice variants.
A) Agarose gel electrophoresis of PCR products from parental and resistant sublines following amplification of CD20 mRNA transcripts. Primers near the start and end of CD20 were used in order to look for potential splice variants. B) Schematic diagram of the CD20 gene. Exons are represented by rectangles. Brackets indicate regions removed in the splice variants. The shaded region in exons 3 and 7 shows the location of non-standard splice sites. The relative size and positions of the rituximab and ofatumumab epitopes are represented by the solid rectangles below.

