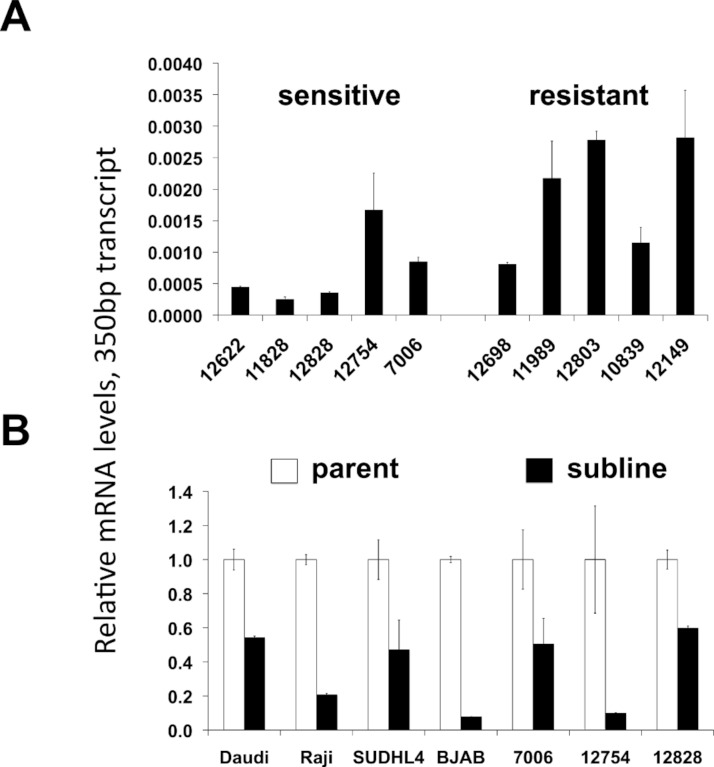
Figure 5. CD20 mRNA levels of the 350 bp splice variant.
Levels of the 350 bp CD20 mRNAs isoform are shown in (A) lymphoblastoid lines that are relatively sensitive or resistant to rituximab, and (B) parental and resistant sublines. Relative CD20 mRNA levels were estimated by qPCR. GAPDH was used as a load control and data are normalized to the level of full-length CD20 of the corresponding parental line, (Fig. 2B). Results are the average of duplicates (±SEM).

