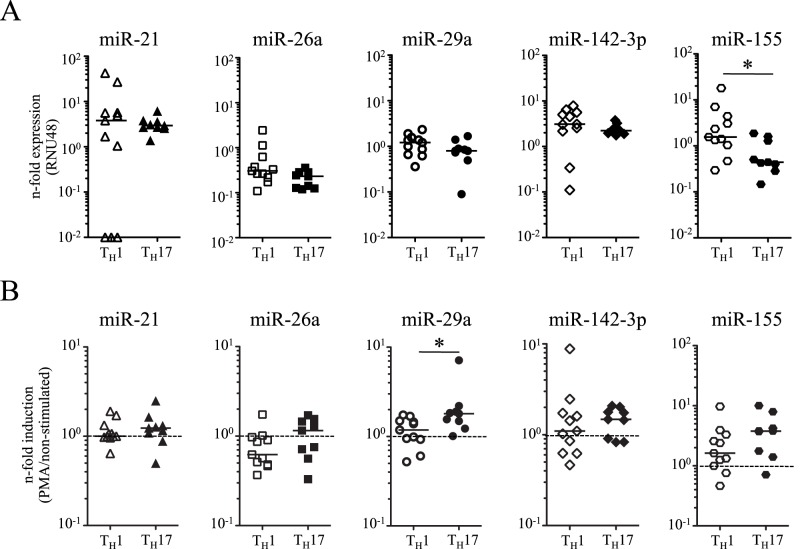
Figure 4. Expression of candidate miRNAs in TH1 and TH17 clones.
Expression of miR-21 (triangles), miR-26a (squares), miR-29a (circles), miR-142-3p (diamonds), and miR-155 (hexagons) was compared between IFNγ-expressing TH1 (open symbols, n = 11) and IL-17-expressing TH17 clones (black symbols, n = 9) of healthy donors prior to (A) and after in vitro activation (B). Expression of candidate miRNAs was normalized to the housekeeping gene RNU48. Median expression and range is shown. Significant differences are indicated as asterisks (* for P<0.05, Mann-Whitney-U test). (B) MiRNA expression after 12 h in vitro re-stimulation with PMA/Ionomycin. Relative expression to the respective non-activated control is shown (dotted line).

