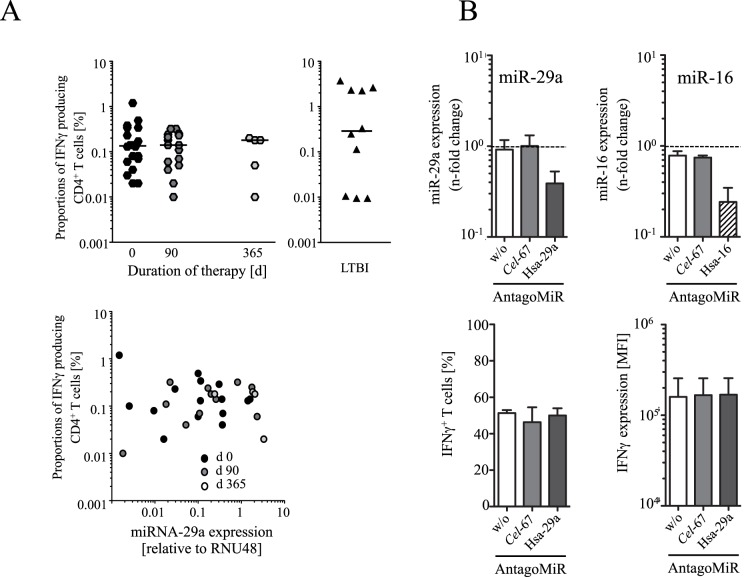
Figure 5. IFNγ and miR-29a expression of infected children and ectopic miR-29a suppression in T cells.
(A) IFNγ expression after short-term in vitro re-stimulation of PBMC from children with tuberculosis (upper left graph) prior to chemotherapy (black symbols), three months under chemotherapy (grey symbols), after recovery (open symbols), as well as children with LTBI (upper right graph) with M. tuberculosis-specific PPD is shown. Proportions of IFNγ expressing CD4+ T cells (y-axis) for different time points after treatment onset of patients (x-axis) are depicted. Each symbol represents data from an individual patient with tuberculosis (hexagon) or LTBI (filled trigon). Ex vivo whole blood miR-29a expression (x-axis) in comparison to the proportions of IFNγ expressing CD4+ T cells (x-axis) for individual children with TB under therapy (circles) is shown in the lower graph. (B) Modulation of miR-29a expression (upper left graph) and control miR-16 (upper right graph) of CD4+ T cells by specific antagomirs (Homo sapiens (Hsa)-29a, Hsa-16, and Caenorhabditis elegans (Cel)-67) and effects on IFNγ expression (lower graphs) are depicted. IFNγ expression of activated CD4+ T cells after miR-29a or miR-16 suppression is shown as proportions of IFNγ+ cells (lower left graph) or as the IFNγ expression level per cell (indicated by median fluorescence intensities (MFI)) (lower right graph).

