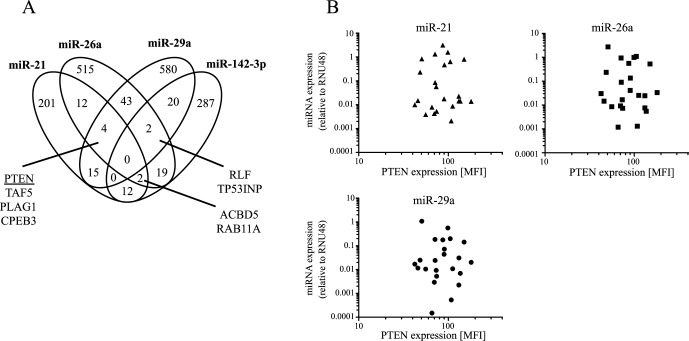
Figure 6. Target genes and overlaps for miR-21, miR-26a, miR-29a and miR-142-3p.
(A) A Venn diagram indicates the overlap of target genes for miR-21, miR-26a, miR-29a and miR-142-3p. Common targets of at least three candidate miRNAs are listed by name. (B) Comparison between expression miR-21 (upper left graph), miR-26a (upper right graph), miR-29a (lower graph) and protein expression of the common target PTEN in lymphocytes from children with tuberculosis (n = 19) and LTBI (n = 3) is shown. We indicate relative miRNA expression to house keeping gene RNU48 by quantitative PCR and compare this to PTEN protein expression determined by flow cytometry using median fluorescence intensity (MFI) analysis. Each symbol represents data from an individual donor.

