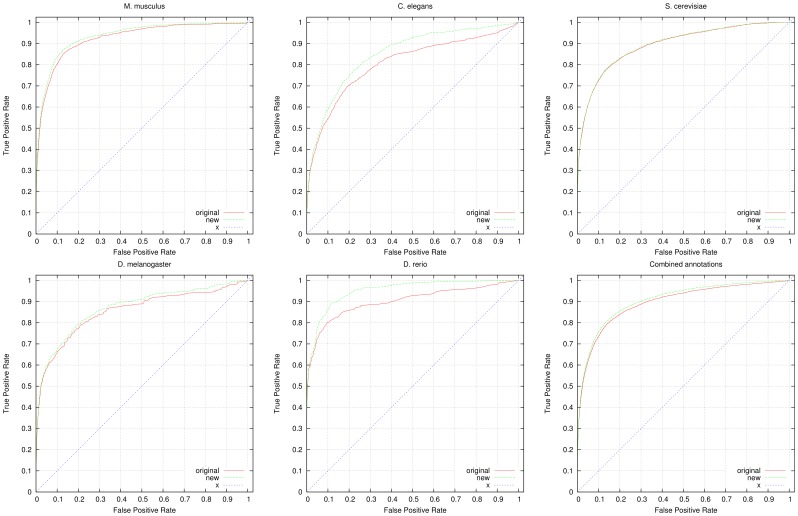
Figure 2. ROC curves for predicting genetic interactions.
We compare the performance of predicting genetic interactions using all available annotations from GOA (labeled “original” in the graphs) and using GOA’s annotations combined with our inferred functions (labeled “new” in the graphs). For the evaluation, we used 4,061 genetic interactions in yeast, 783 interactions in fly, 169 interactions in fish, 3,970 interactions in mouse and 893 interactions in worm. We also show the ROC curve resulting from the combined annotations and interactions in all five species. All ROC curves include the line of no-discrimination (labeled “x” in the graphs). The detailed evaluation results are provided as supplementary material.

