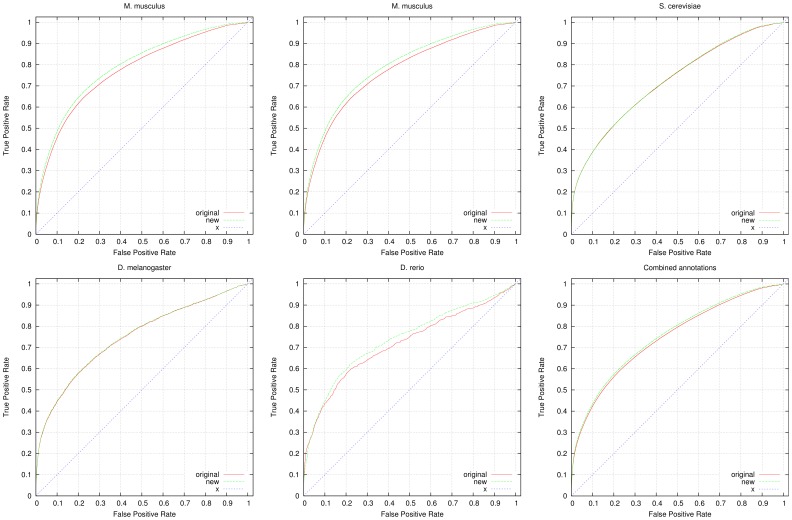
Figure 4. ROC curves for prediction of STRING [21] protein-protein interactions.
We compare the performance of predicting STRING’s protein-protein interactions using all available annotations from GOA (labeled “original” in the graphs) and using GOA’s annotations combined with our inferred functions (labeled “new” in the graphs). For the evaluation, we used 73,245 interactions in yeast, 4,422 interactions in fly, 1,085 interactions in fish, 42,322 interactions in mouse and 11,517 interactions in worm. We also show the ROC curve resulting from the combined annotations and interactions in all five species. All ROC curves include the line of non-discrimination (labeled “x” in the graphs). The detailed evaluation results are provided as supplementary material.

