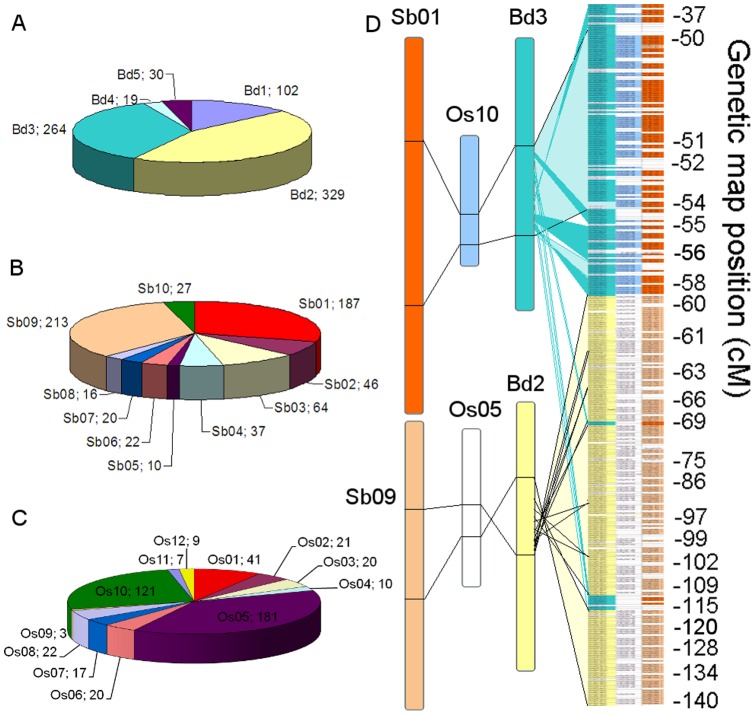
Figure 4. Relationship between gene-based markers on 1AL and conserved genes in sequenced grass species.
A. Chart showing the number of gene-based markers found to have homologs on each B. distachyon chromosome by similarity searches. B. Chart showing the number of gene-based markers found to have homologs on each Sorghum bicolor chromosome by similarity searches. C. Chart showing the number of gene-based markers found to have homologs on each Oryza sativa chromosome by similarity searches. D. The contig order of the synteny-based physical map is shown (right), with genetically mapped marker positions marked in cM. Each horizontal line represents a single contig on the physical map. Connection lines show the locations of syntenic regions on B. distachyon chromosomes 3 & 2, and equivalent regions on Oryza sativa chromosomes 10 & 5, and S. bicolor chromosomes 1 & 9.

