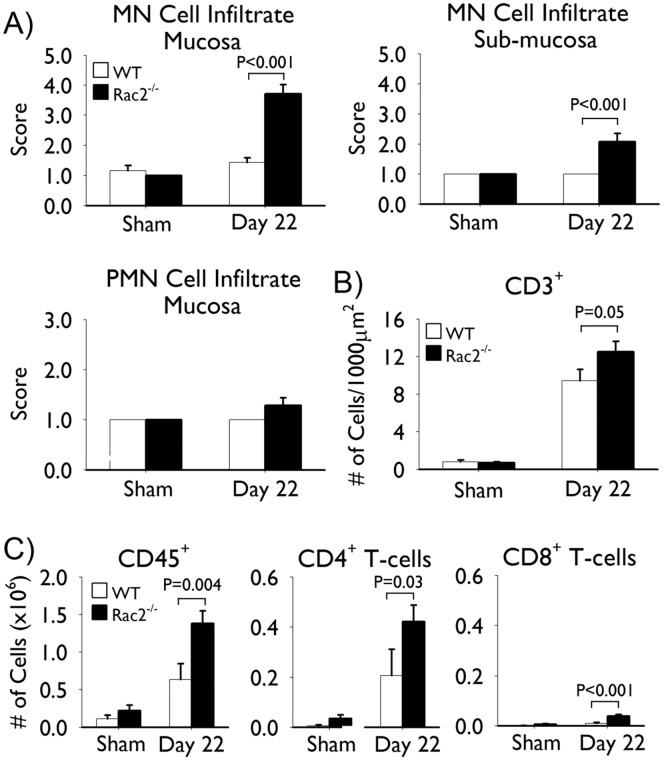
Figure 5. Rac2−/− mice infected with Citrobacter rodentium develop marked mononuclear cell infiltration at day 22 of infection.
Separate groups of wild-type (WT; white bars) and Rac2−/− (black bars) mice were infected with C. rodentium or given vehicle control (sham) by orogastric gavage. (A) Scoring of mononuclear and polymorphonuclear cell infiltration into the submucosa and/or mucosa at day 22 of infection. (B) Average number of CD3+ cells per crypt in colon tissues obtained at day 22 of infection. (C) Flow cytometric analysis of colon digests showing the number of total leukocytes (CD45+ cells), T-helper (CD45+ CD3+ CD4+), and cytotoxic (CD45+ CD3+ CD8+) T-cells. n = 3–8/group in (A-B) and n = 3–4/group in (C). Data are expressed as mean ± SEM and are from one of two independent experiments. Statistical analysis was performed using two-way ANOVA with Tukey’s post hoc test.

