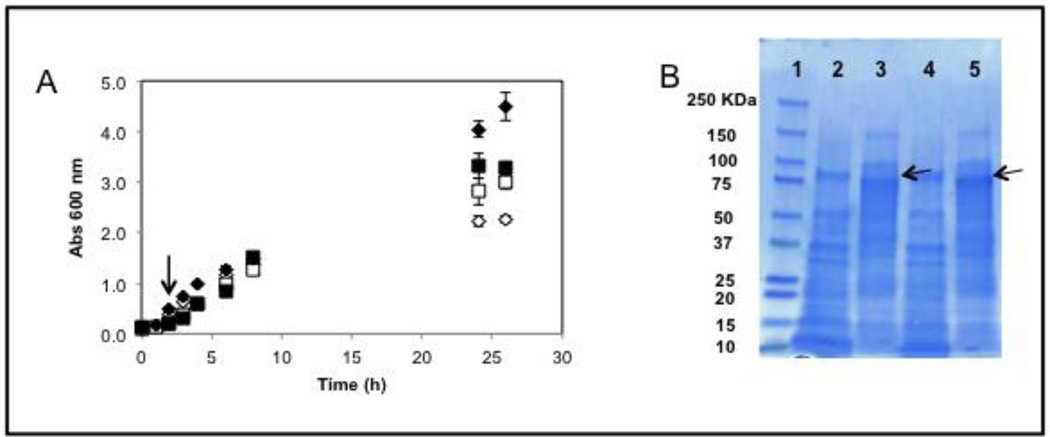
Figure 1.
E. coli 6-OST-1 shake flask growth in different media. A) 26 h growth curves on (◊) induced LB; (♦) not induced LB; (□) induced glycerol and soya peptone; (■) not induced glycerol and soya peptone. Induction was performed with 0.2 mM IPTG at 0.6 Abs600nm, as indicated by the arrow. B) SDS-PAGE analysis of crude extracts; lane 1: 250-10 KDa ladder; lane 2: not induced LB, lane 3: induced LB, lane 4: not induced glycerol and soya peptone, lane 5: induced glycerol + soya peptone. 6-OST-1 bands are indicated in lane 3 and 5 by arrows.

