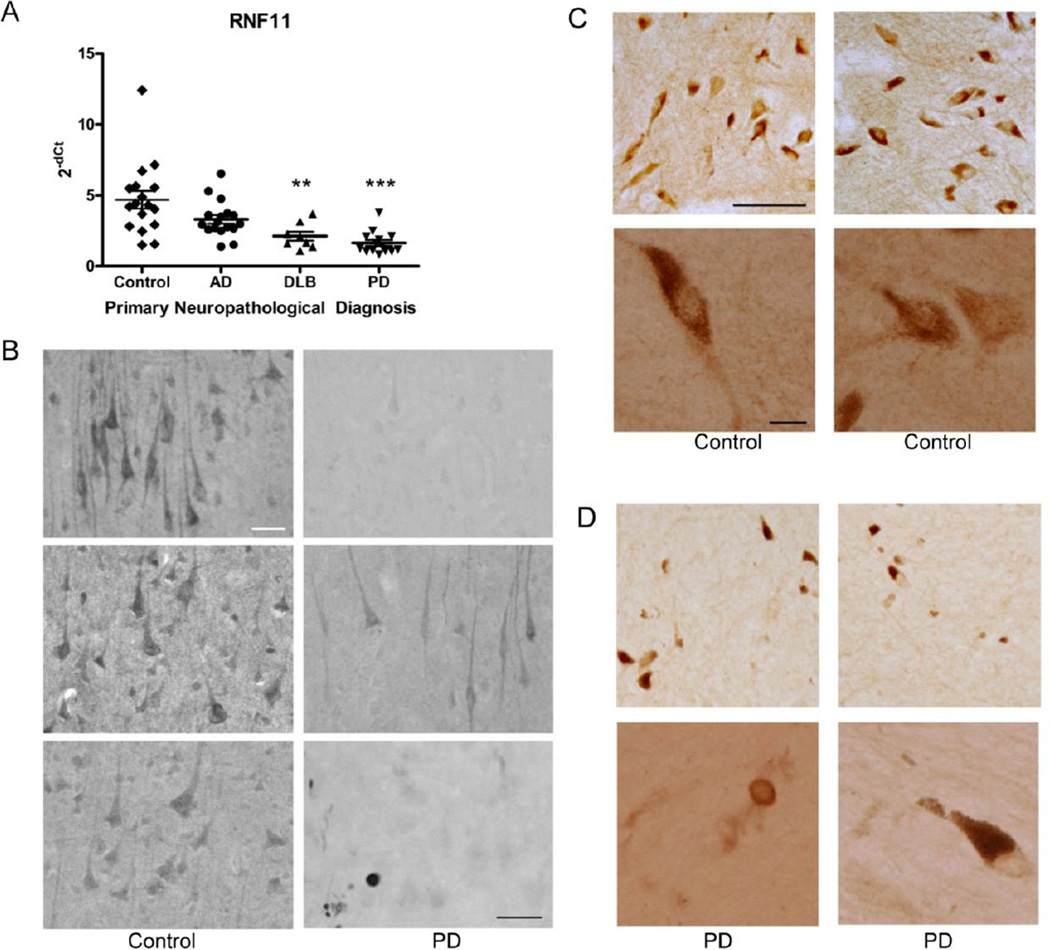
Figure 7. Down-regulation of RNF11 mRNA and protein expression in Parkinson’s disease brain tissue.
A. Total RNA was extracted from neocortical tissue of control, Alzheimer’s disease (AD), dementia with Lewy bodies (DLB), and Parkinson’s disease (PD) cases and examined by real-time PCR for expression of RNF11 mRNA. Values expressed are mean comparative cycle threshold ± SEM with GUSB levels as an internal control. **, P < 0.01; ***, P < 0.001 from control. B. Frontal cortex from control and PD cases was analyzed by immunohistochemistry using an antibody against RNF11. Scale bar: 50 µM. Bottom right panel, scale bar: 25 µM. C, D. Substantia nigra from control (C) and PD cases (D) was analyzed by immunohistochemistry using an antibody against RNF11. Top row in each, scale bar: 100 µM. Bottom row in each, scale bar: 25 µM.

