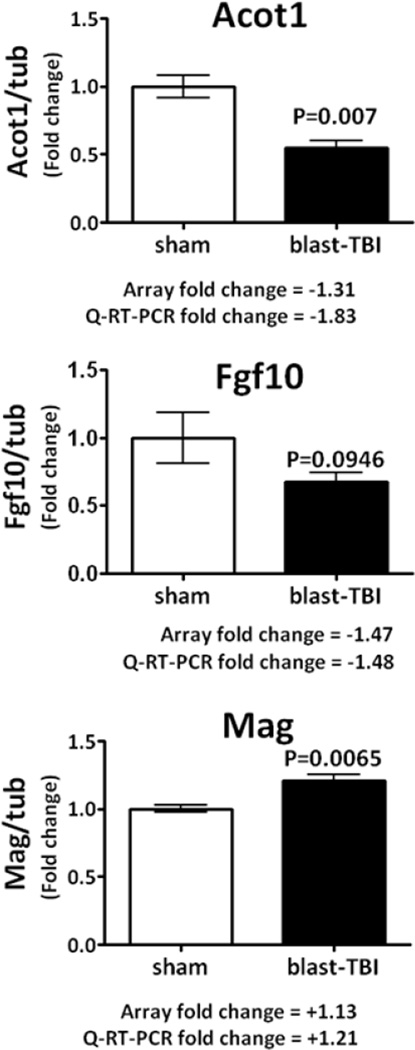
Figure 4.
Q-RT-PCR data obtained for hippocampus genes measured in the same RNA samples used in the gene array studies are presented; the relative levels of gene transcripts are expressed as a fold change normalized to the house keeping gene alpha-tubulin. For the selected genes, although the fold changes in expression were small, less than a 2 fold change, for the three genes examined there was a strong agreement between the gene array and Q-RT-PCR fold change in gene expression. Data are expressed as mean ± SEM, of n, observations; sham, n=5; blast-TBI, n=7. The appropriate statistical p values are presented.

