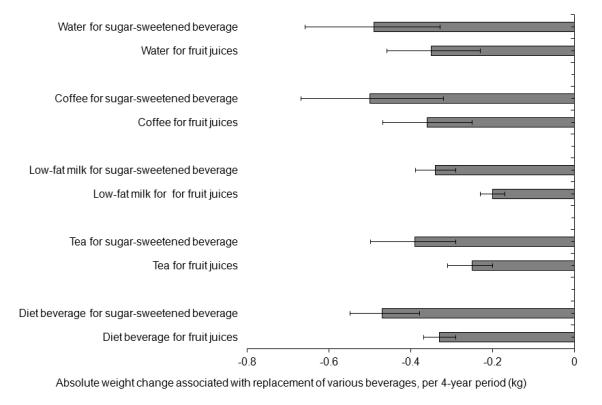
Figure 1.

Changes in absolute body weight associated with serving-to-serving replacements between beverages per 4-year period
Data are based on 20 years of follow-up (1986–2006) in the Nurses’ Health Study, 16 years of follow-up (1991–2007) in the Nurses’ Health Study II, and a 20 years of follow-up (1986–2006) in the Health Professionals Follow-up Study. Values were adjusted for age and baseline body mass index at the beginning of each 4-year period, sleep duration, as well as for changes in physical activity, alcohol use, television watching, smoking, dietary variables (fruits, vegetables, whole grain, refined grain, potatoes, potato chips, red meat, other dairy products, sweets and desserts, nuts, fried foods and trans-fat), and all the beverage variables (water, coffee, sugar-sweetened beverages, fruit juices, whole milk, low-fat milk, tea, and diet beverages) simultaneously within each 4-year period. The results were absolute weight changes (kg) associated with serving-to-serving substitution between beverages, and were pooled by an inverse-variance-weighted random-effects meta-analysis across the three cohorts. The error bars indicate 95% confidence intervals.
