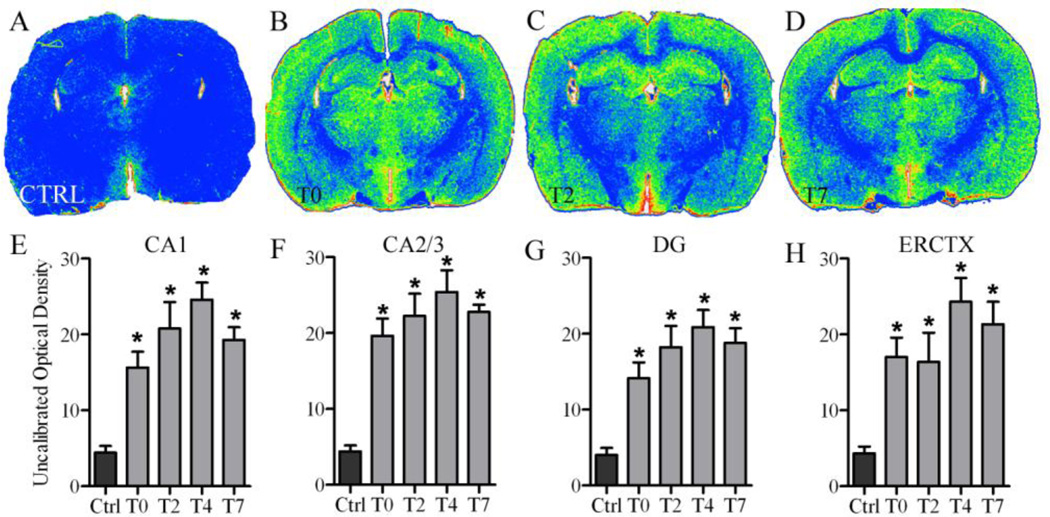
Figure 1. [3H]-PK-11195 upregulation following 4-day binge exposure.
Representative false color autoradiographs depicting [3H]-PK-11195 binding are shown for (A) controls (n=8; black bars) as well as (B) ethanol (grey bars) at T0 (n=6), (C) T2 (n=6), and (D) T7 (n=6). Quantitative analysis of the extent of binding are graphed for the (E) CA1, (F) CA2/3, (G) DG, and (H) entorhinal cortex. *p<0.05

