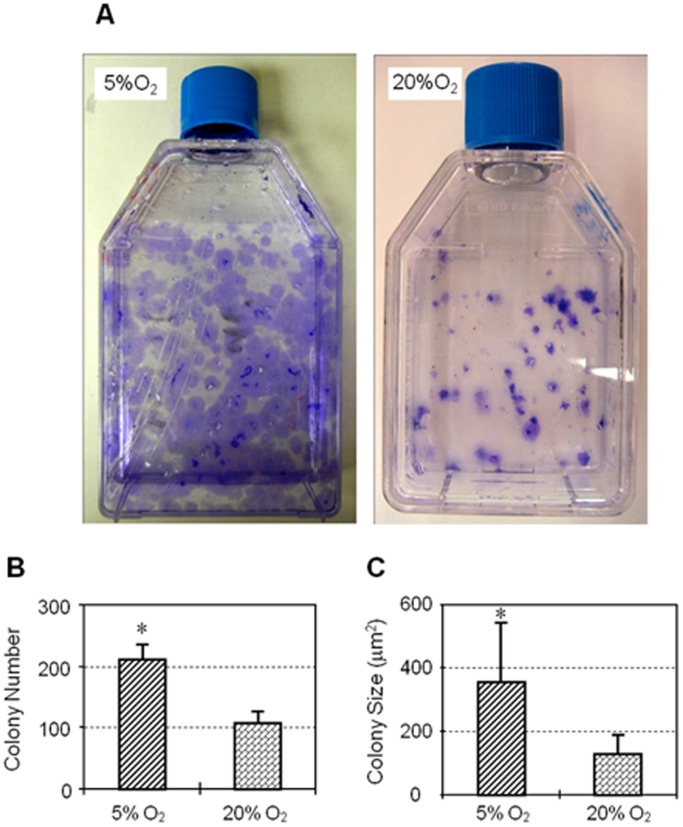
Figure 1. A. Colony formation by hTSCs under hypoxic and normaxic culture conditions.
T-25 flask maintained in 5% O2 (left) shows a number of large methyl violet stained hTSC colonies while the flask in 20% O2 (right) has fewer and smaller colonies. B. Quantification of hTSC colony numbers under hypoxic and normaxic conditions. Colony numbers in 5% O2 were twice that in 20% O2. Two flasks of hTSCs each were used to calculate colony numbers in hypoxic and normaxic conditions. C. Quantification of hTSC colony sizes under hypoxic and normaxic conditions. Colony size of hTSCs in hypoxic condition (5% O2) was about 2.8 times larger than in normaxic condition (20% O2). Asterisks represent P<0.05.

