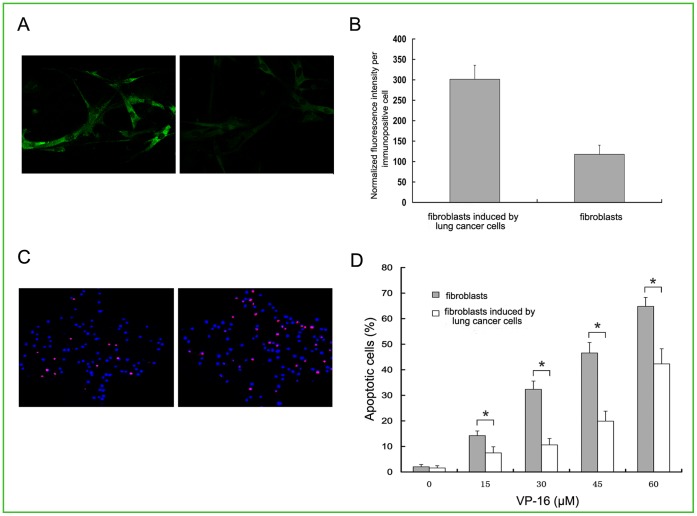
Figure 2. Analysis of α-SMA expression and measurement of apoptosis in fibroblasts induced and non-induced by lung cancer cells.
(A) α-SMA protein assay by immunofluorescence imaging on fibroblasts induced and non-induced by lung cancer cells. (a) Induced. (b) Non-induced. Magnification: ×600. (B) The average expression of α-SMA in per cell was reflected by normalized fluorescent intensity. Data were shown as mean±SD of triplicate determinations. (C) Fluorescent analysis of apoptosis in fibroblasts induced and non-induced by lung cancer cells with PI and Hoechst after treatment with VP-16 (30 µM). Magnification: ×100. (D) The statistic analysis of percentage of apoptotic cells induced and non-induced by the lung cancer cells after treatment with different concentrations of VP-16 (0–60 µM). *p<0.05 compared with the control group. All the experiments were repeated at least three times.

