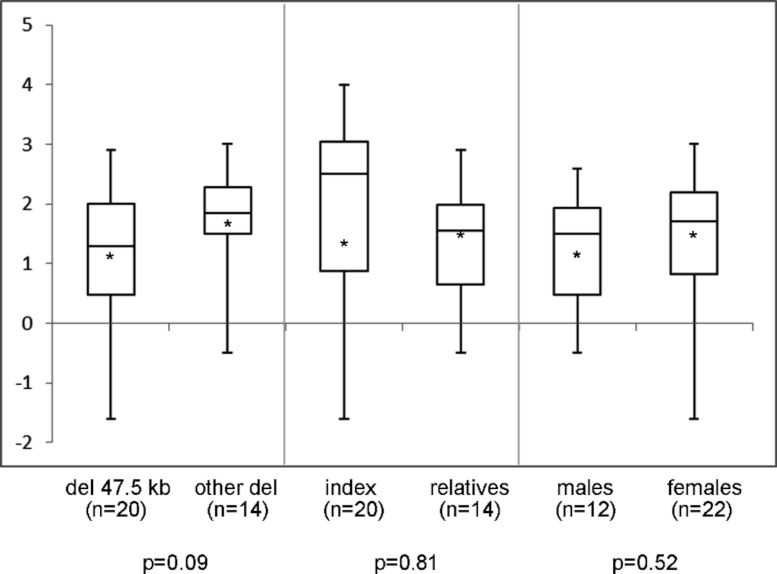
Figure 3. Sitting height to height ratio (SDS) range in different subgroups of patients.
Sitting height to height ratio (SDS) range in different subgroups of patients with a deletion in the downstream enhancer region of SHOX. del 47.5 kb = deletion that includes PAR1 probes L05099-L05101 in the downstream enhancer of SHOX; other del = larger deletion in the downstream enhancer of SHOX; ∗ = mean value; n = number of tested individuals; p = p-value measured by t-test.

