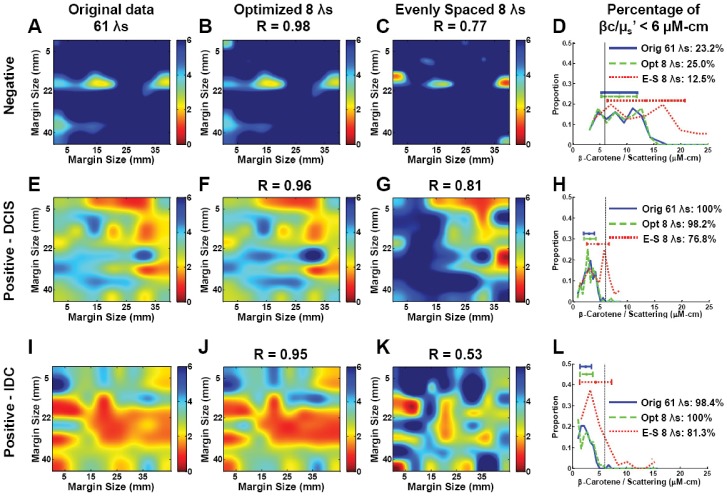
Figure 7. Example spectral images of negative and positive margins obtained with and without optimization.
Representative margin maps of [βc]/<µs’> for normal (A–C), ductal carcinoma in situ (E–G), and invasive ductal carcinoma (I–K) using the full 450–600 nm spectrum, the optimized 8 wavelengths, and the un-optimized evenly spaced 8 wavelengths. Corresponding correlation coefficients for the 61-wavelength spectra and the reduced 8-wavelength spectra are shown. Distribution of the extracted βc/µs’ are shown in (D), (H), and (L) for each case, along with the threshold values used in the predictive model to separate positive from negative margins.

