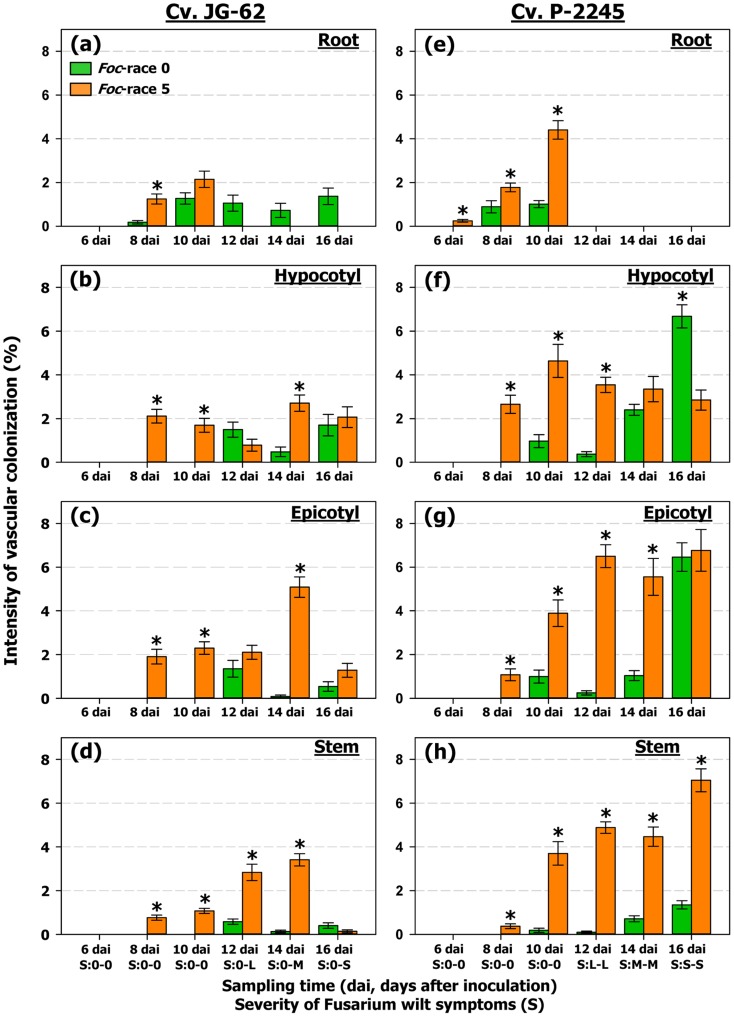
Figure 5. Intensity of vascular colonization (ItCV) by races 0 and 5 of Fusarium oxysporum f. sp. ciceris.
The Fusarium oxysporum f. sp. ciceris (Foc) isolates were transformed with the ZsGreen fluorescent protein. Plants were sampled daily from 1 to 4 days after inoculation (dai), and at 2 days intervals from 6 to 18 (dai). Tissues sampled included: Root: lower and intermediate zone of the tap root (a, e); Hypocotyl (b, f) and epicotyl (c, g): zones immediately before and after the insertion of cotyledons, respectively; Stem (d, h): internodes one to fifth of the main stem. Severity (S) indicate the disease severity (DS) level of foliar symptoms assessed at each sampling time using a 0 to 4 scale based on the percentage of affected foliar tissue (0 = 0%, 1 = 1 to 33%, 2 = 24 to 66%, 3 = 67 to 100%, and 4 = dead plant). S = 0: no symptoms; S = L: initial symptoms (0<DS<2); S = M: moderate symptoms (2<DS≥3); and S = S: severe symptoms (DS≥3), for Foc-0 (first character) and Foc-5 (second character). There were four plants (two plastic pots) per F. oxysporum f. sp. ciceris race/chickpea cultivar combination analysed for each sampling time. The experiments were arranged in a randomized complete blocks design, and were repeated twice. For each sampled tissue, vascular colonization was assessed on four blocks with 20 cells (xylem vessels) per block, covering the entire vascular cylinder. Error bars indicate the standard error of the mean. Significant differences (P<0.05) between ItCV level reached on races 0 and 5 for each chickpea cultivar/tissue combination at each sampling date are indicated by an asterisk.

