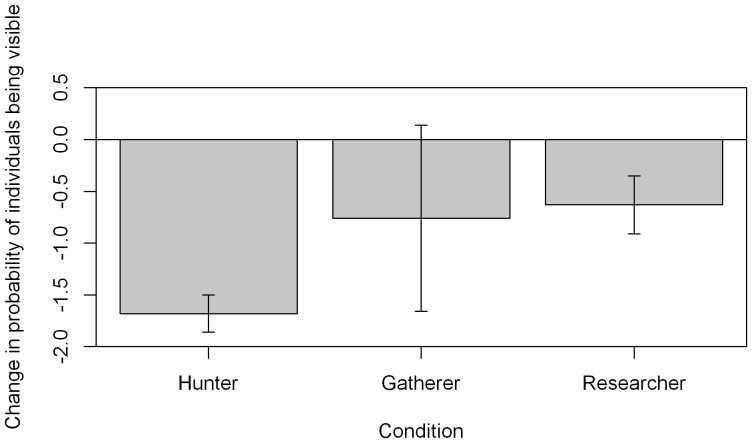
Figure 5. Change in visibility in the 30 minutes after experimental presentation.
Change in probability any individual in the group being visible (logit scale to allow standard errors to be displayed) in the 30 minutes after start of experimental presentation, compared with the previous 30 minutes. Data from both sites is shown. Error bars show standard errors of the estimate. P values of differences between the period before and after experimental presentation are shown: * p = 0.05–0.01, **p = 0.01–0.001, ***p<0.001. Hunter condition: Wald test, Z = 9.17, df = 1, p<0.001. Researcher condition: Wald test, Z = 2.3, df = 1, p = 0.022. Gatherer condition: Wald test, p>0.05.

