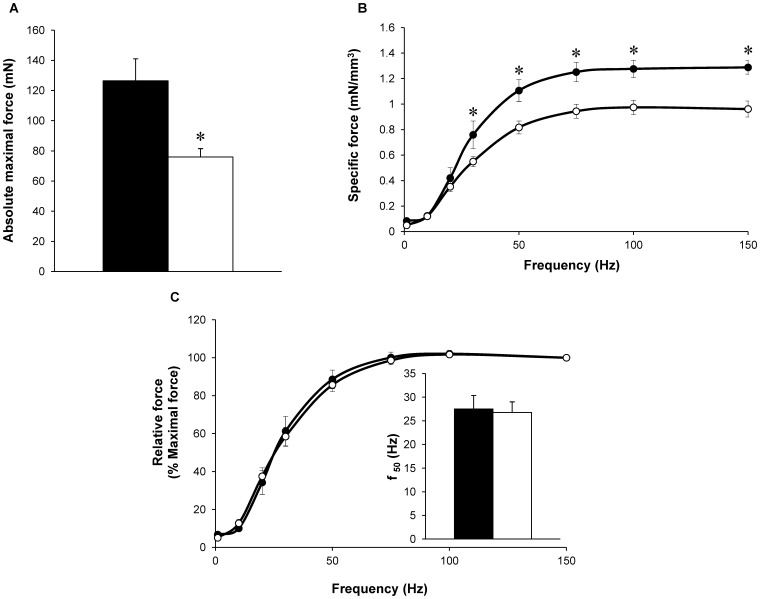
Figure 2. Absolute maximal force production (A), specific (B) and relative (C) force production during the force-frequency protocol in H40Y (○) and WT (•) groups.
Force was normalized to hindlimb muscles volume (B) and to maximal force obtained at 150 Hz (C). f50 (inset fig. C) represents the frequency providing 50% of maximal force. Maximal force was lower in H40Y group as compared to WT group whereas f50 was similar between the two groups. Values are presented as mean ± SEM. Significantly different between groups *P<0.05.

